Point of Sale Software

Here are some Articles from the Blog Subject - Reports -

How to use your data to have better stock control

POS SOFTWARE

Stock trends

We are all balancing inventory—excess stock ties up capital, while insufficient stock can result in lost sales opportunities.
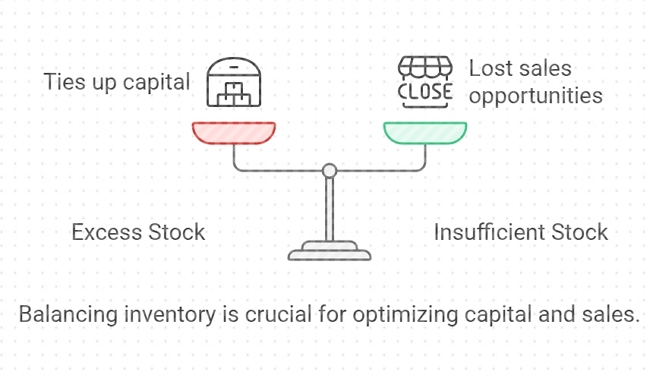
Balancing inventory levels

Here is a simple key to improving your stock control that is available now, and it will boost your bottom line.

Understanding the Power of Historical Data

Big suppliers don't just guess about stock control—they rely on historical data. They compare monthly sales year over year to identify trends and patterns. They tend to use 24 months of your data, which helps them account for seasonal fluctuations and make more accurate predictions.

But with a modern POS system, you've got all the tools you need to play in the big league.

Why Your POS Data is Gold

Your POS system isn't just for processing transactions, it full of valuable information. Here's why it's better for you than your supplier's information:

Real-time sales data

Unlike your suppliers, who only see what you've ordered, your POS system shows exactly what you've sold.

Seasonal insights

By comparing data from the same months across different years, you can spot seasonal trends specific to your business.

Stock level optimisation

With accurate sales data, you can decide how much stock to hold.

How to Use Your POS Data for Better Stock Control

Let's walk through a practical example of how you can use your POS data to improve your stock control:

Access your sales report

You'll find this under 'Reports'> 'Sales'> 'Stock Sales Details 24 Month Trend'.

Filter your data

For this exercise, we'll keep it simple:

Exclude inactive stock Filter by department or supplier

Look for patterns in your sales data. Are certain items consistently selling well? Do some products have seasonal spikes?

Evaluate stock levels

Compare your current stock levels with your average monthly sales. Do you need to be more overstocked on slow-moving items?

Case Study: Spotting Overstock Issues

Let's look at a couple of examples from our report:

Product A

Average sales: 2 per month Current stock: 6 units Stock cover: 3 months. If you can reorder this product weekly, holding three months of stock might be excessive. Consider reducing your stock levels to free up capital.

Product B

Average sales: 0.5 per month (1 every two months) Current stock: 16 units Stock cover: 32 months (nearly three years!) This is a clear case of overstocking. Unless there's a specific reason for holding so much stock (like a bulk discount or upcoming promotion), you should look at significantly reducing your inventory of this item.

Turning Insights into Action

Now that you've got this knowledge, here are some steps you can take:

Adjust your reorder points

Use your sales data to set more accurate reorder points for each product.

Negotiate with suppliers

Armed with solid data, you can better negotiate order quantities and frequencies with your suppliers. In my experience, most suppliers will listen to you if you have an issue.

Plan for seasonality

If you spot seasonal trends, plan your stock levels accordingly.

Clear out, slow movers.

Identify products that aren't selling well; now you have something to think about and what to do with them.

Focus on your winners

Make sure you're well-stocked with these winners.

The Bottom Line

Leverage your POS data; don't guess. Make informed decisions about your inventory. This approach can help you: Reduce tied-up capital Minimise storage costs Avoid stockouts of popular items With your cash flow

Your POS system is a powerful tool that gives you the information you need to compete.

Our POS software makes it easy to access and analyse sales data.

Contact us to learn how we can help you optimise your stock control and boost your profits.​


Add new comment

Restricted HTML

  • Allowed HTML tags: <a href hreflang> <em> <strong> <cite> <blockquote cite> <code> <ul type> <ol start type> <li> <dl> <dt> <dd> <h2 id> <h3 id> <h4 id> <h5 id> <h6 id>
  • Lines and paragraphs break automatically.
  • Web page addresses and email addresses turn into links automatically.
CAPTCHA This question is for testing whether or not you are a human visitor and to prevent automated spam submissions. Image CAPTCHA
Enter the characters shown in the image.

Comparisons with previous sales figures

POS SOFTWARE


As someone in retail my whole life, let's dive into how our POS software can give you a crystal-clear view of your business performance.

Monthly Comparisons: The Traditional Approach

Most people do their sales comparisons by month, and it works, but comparing sales periods can be a headache that way if trying to compare retail sales:

  • Weekend wobbles: Some months have four Saturdays, others have five. This can throw your figures out of whack.
  • Holidays: Not all holidays are celebrated on the same date in different years. For example, most religious festivals follow the lunar calendar.

Still, it does have some advantages:

  • Alignment with financial cycles: Most businesses operate on monthly accounting cycles.
  • Simplicity: Everyone understands what a month is, making it easy to understand.
  • External benchmarking: Many industry reports are released monthly, allowing for easier comparison with broader market trends.
  • Seasonal patterns: Most seasonal patterns align well with calendar months.

The Four-Week Comparison

I've found that comparing the last four weeks of sales to the same four-week period from the previous year is great for retail. Here's why:

  • Smooth out daily hiccups: You iron out any unusual spikes or dips by looking at four weeks.
  • Captures recent trends: This method gives you a snapshot of your most recent performance.
  • Accounts for seasonality: Comparing to last year's period helps you factor in seasonal variations.
  • Flexible timing: You can run this comparison whenever possible, not just at the month's or quarter's end. This is a massive plus for me.

Our POS System: Flexibility is Key

We've designed our POS system with these challenges in mind. Here's how it helps you cut through the confusion:

Custom Comparisons at Your Fingertips

Our POS Software lets you choose custom comparison periods. You're not stuck comparing fixed calendar months or years. Pick any date range that makes sense for you:

  • Last Fiscal Year
  • Last Year
  • Last Quarter
  • Last Month
  • Last four weeks

Rolling with the Changes

One of our most powerful features is the ability to use rolling or moving time frames. For example:

  • Compare the last 30 days to the same 30-day period last year
  • Check how you're doing this year compared to the same point the previous year

Why Accurate Comparisons Matter

Having this flexibility in your sales reporting can be a game-changer. Here's why:

  • Smarter decisions: Accurate comparisons help you make better calls on inventory, staffing, and promotions.
  • Realistic goals: Understanding your actual performance helps you set achievable targets.
  • Trendspotting: You'll see patterns in your sales data that calendar quirks might otherwise hide.

Making Your POS Data Work for You

To squeeze the juice out of your POS system's reporting capabilities, try these tips:

  1. Regular check-ins: Set aside weekly or monthly time to analyze your sales data. Most people do this monthly.
  2. Mix it up: Try different comparison periods to gain new insights. Doing it in the long and short term is a good idea.
  3. Look beyond the numbers: Use the data as a starting point to understand the story behind your sales.

Wrapping Up: Your Data, Your Decisions

Remember, the goal isn't just to have data – it's to use that data to drive your business forward. With the right tools and approach, you can turn your sales figures into a roadmap for success.

Whether you choose four-week comparisons, monthly analysis, or a combination of both, the key is understanding each method's strengths and limitations. By being aware of factors like the varying number of Saturdays a month, you can make more informed decisions, set more realistic targets, and get an actual picture of your business performance.

So, dive into your data, experiment with different comparison methods, and watch your business thrive.

Frequently Asked Questions (FAQ)

Q: Why is comparing sales by month sometimes problematic for retailers?

A: Monthly comparisons can be tricky due to varying numbers of weekends and shifting holiday dates. This can lead to inconsistent data when comparing different months or years.

Q: What's the advantage of using a four-week comparison method?

A: Four-week comparisons provide more consistent data by constantly comparing the same number of days of the week. This method smooths out daily fluctuations and accounts for seasonality while offering flexible timing for analysis.

Q: Can I still use monthly comparisons with your POS software?

A: Absolutely! Our POS software allows for monthly and custom period comparisons. Choose the method that suits your needs.

Q: How often should I analyse my sales data?

A: We recommend regular monthly. However, with our flexible reporting, you can analyze your data as frequently as you need.

Q: What's a "rolling time frame" in sales comparison?

A: A rolling time frame allows you to compare a recent period (like the last 30 days) to the same period from a year ago, regardless of calendar months. This provides a current view of performance trends.

Q: How can accurate sales comparisons improve my business?

A: Accurate comparisons lead to more thoughtful inventory and staffing decisions, help set realistic goals, and allow you to spot trends that might otherwise be hidden by calendar quirks.

Q: Is switching between different comparison methods in your POS software difficult?

A: Not. Our POS System is designed for flexibility. You can easily switch between monthly, four-week, and custom period comparisons with a click.

Q: Can your POS software help with external benchmarking?

A: While our software focuses on your internal data, the flexible reporting makes it easier to align your data with external monthly reports for industry comparisons.

Q: How does the POS software handle seasonal patterns in sales?

A: Our software allows you to compare periods year-over-year, helping you account for and analyze seasonal patterns in your sales data.

Q: Is training provided on how to use the comparison features in your POS software?

A: Yes, we provide comprehensive training on all features of our POS software, including how to use our flexible sales comparison tools effectively.

Add new comment

Restricted HTML

  • Allowed HTML tags: <a href hreflang> <em> <strong> <cite> <blockquote cite> <code> <ul type> <ol start type> <li> <dl> <dt> <dd> <h2 id> <h3 id> <h4 id> <h5 id> <h6 id>
  • Lines and paragraphs break automatically.
  • Web page addresses and email addresses turn into links automatically.
CAPTCHA This question is for testing whether or not you are a human visitor and to prevent automated spam submissions. Image CAPTCHA
Enter the characters shown in the image.

How important is a supplier to you?

POS SOFTWARE

Suppliers occupy a unique position in our business ecosystem. They're crucial – after all, they provide the products we sell. However, their priorities may not always mirror our own. Navigating this paradox is a skill that can set your business apart.

Pros: The Supplier

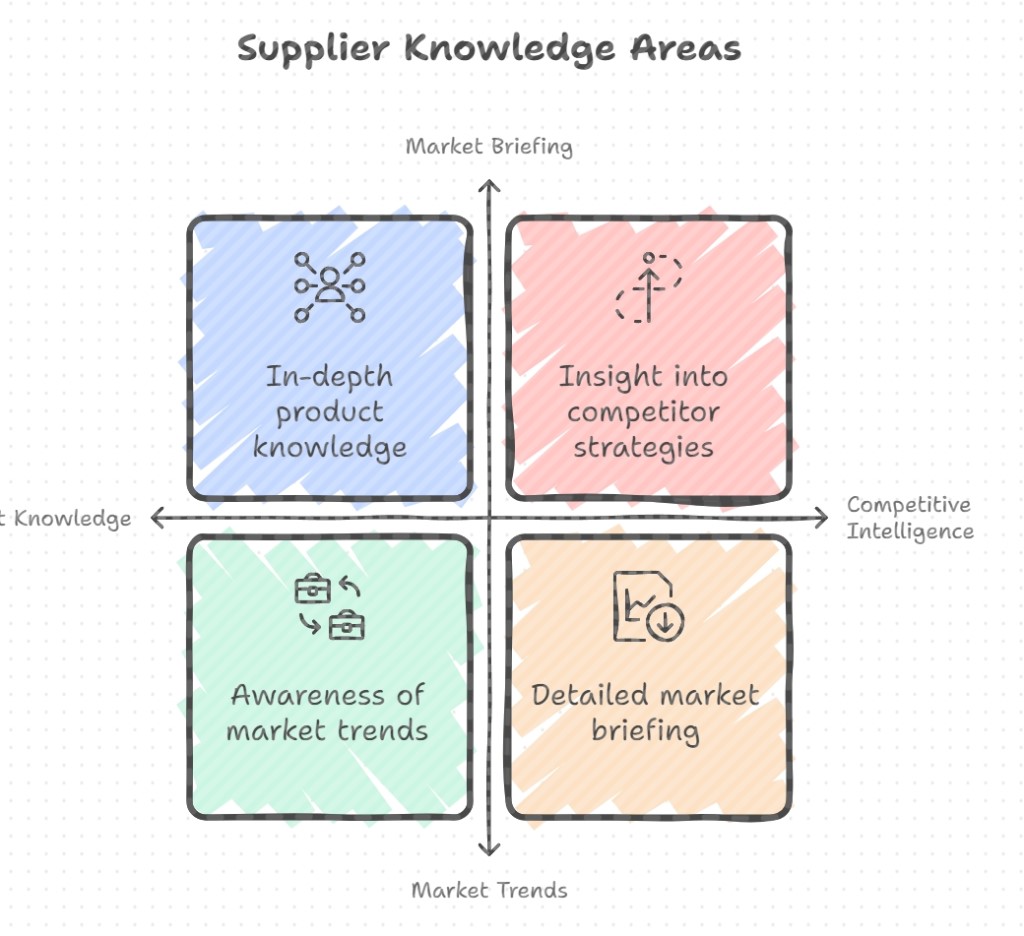
Suppliers often hold a wealth of knowledge about:

  • They know a lot about the products.
  • Suppliers' agents travel, and they know what is happening in the market and the trends.
  • Suppliers are better briefed as to what is happening with their market
  • They know what your competitor's strategies are and what they are doing.


Supplier information advantages


They may be able to offer you a better deal.

This information can be precious, but it's up to us to tap into it effectively.

Cons: The Supplier

  • A supplier rep will tend to prioritize their company's interests over yours, potentially leading to biased advice or recommendations.
  • They do not have a comprehensive view of your business needs
  • Over-reliance on a supplier might limit your ability to negotiate effectively with other suppliers.
  • Managing relationships with supplier reps can be time-consuming

It's important to note that these are potential drawbacks and the actual impact would depend on how the relationship with the supplier representative is managed within the broader context of your supplier relationship management strategy.

Supplier Relationship Management

This requires supplier relationship management (SRM), which isn't just some fancy term by business consultants.

It's a critical strategy for any business, but we need to answer one crucial question:

What importance does each supplier hold for your organization?

The Data Goldmine of Your POS System

Here's where your POS system becomes your secret weapon. In seconds, you can determine this information about your suppliers' performance. Here is how you do it:

  1. Open your POS system.
  2. Navigate to Cash Register Reports > Sales - Stock > Supplier Stock Sales for a Given Period.
  3. Select the last financial year
  4. Hit that 'Generate Report' button

In seconds, you'll have a detailed summary of sales by supplier. You can see precisely how each supplier contributes to your bottom line.

Here are the key areas to focus on:

Quantity Kings: Bringing in the Crowds

Look for the suppliers topping the 'Quantity' column. These are your traffic drivers whose products people are coming to buy from your shop. This is what is bringing customers into your shop.

Profit Champions: Paying the Bills

Next, check out the leaders in the 'Profit' column. These suppliers might not sell the most units but contribute significantly to your bottom line. They're the ones keeping the lights on, and the staff paid.

Putting the Data to Work: My Personal Experience

When I ran this report for a customer, they were shocked to discover that one of their small suppliers was so profitable. They had been focusing all their energy on others and neglecting this hidden gem.

Armed with this information, they actually:

  1. Renegotiated terms with this top profit-generating supplier
  2. Allocated more shelf space to their products

The result? A 14% increase in profitability in just a few months.

In Conclusion: The Data-Driven Path to Supplier Success

In our current retail ecosystem, instinct-based decisions are increasingly obsolete. Leveraging your POS system's data with relationship-building solid prowess can elevate supplier interactions from mundane necessities to crucial differentiators.

Don't underestimate your POS system – it's not merely a cash register. It is so much more. Consider it a powerful business intelligence platform. Take the plunge, run those reports, and unveil unexpected supplier insights. You might stumble upon a hidden asset.

Frequently Asked Questions about Supplier Relationship Management (SRM)

What is meant by supplier relationship management?

Supplier relationship management (SRM) is a systematic approach to evaluating and partnering with suppliers. It involves assessing suppliers' strengths, performance, and capabilities to your overall business strategy. SRM aims to maximize the value of supplier interactions by creating closer, more collaborative relationships with key suppliers to uncover new value and reduce the risk of failure

What are the 5 key points of SRM?

While there isn't a universally agreed-upon list of 5 key points, we can identify these crucial aspects of SRM:

  1. Supplier segmentation and classification
  2. Supplier strategy development and execution
  3. Performance measurement and feedback
  4. Collaboration with suppliers
  5. Continuous improvement of your dealing with your suppliers

What are the five types of supplier relationships?

  1. Buy the market relationship
  2. Ongoing relationship
  3. Partnership
  4. Strategic alliance
  5. Backward integration

What are the three basic components of supplier relationship management?

We can here identify these core elements of SRM:

  1. Supplier evaluation and segmentation: Assessing suppliers' strengths, weaknesses, and strategic importance to your business

  2. Relationship development and management: Cultivating personal relationships with suppliers and building trust and mutually beneficial partnerships

  3. Performance monitoring and improvement: Continuously tracking supplier performance, providing feedback, and working collaboratively to enhance the relationship and outcomes


Add new comment

Restricted HTML

  • Allowed HTML tags: <a href hreflang> <em> <strong> <cite> <blockquote cite> <code> <ul type> <ol start type> <li> <dl> <dt> <dd> <h2 id> <h3 id> <h4 id> <h5 id> <h6 id>
  • Lines and paragraphs break automatically.
  • Web page addresses and email addresses turn into links automatically.
CAPTCHA This question is for testing whether or not you are a human visitor and to prevent automated spam submissions. Image CAPTCHA
Enter the characters shown in the image.

How Do I Customize My Favorite POS Software Reports?

POS SOFTWARE

Having your favourite reports in one convenient spot makes using your POS system much easier—you won't have to hunt around for them.

The Power of Personalisation

The ability to customise reports into a favourite area is a game-changer.

Why Customisation Matters

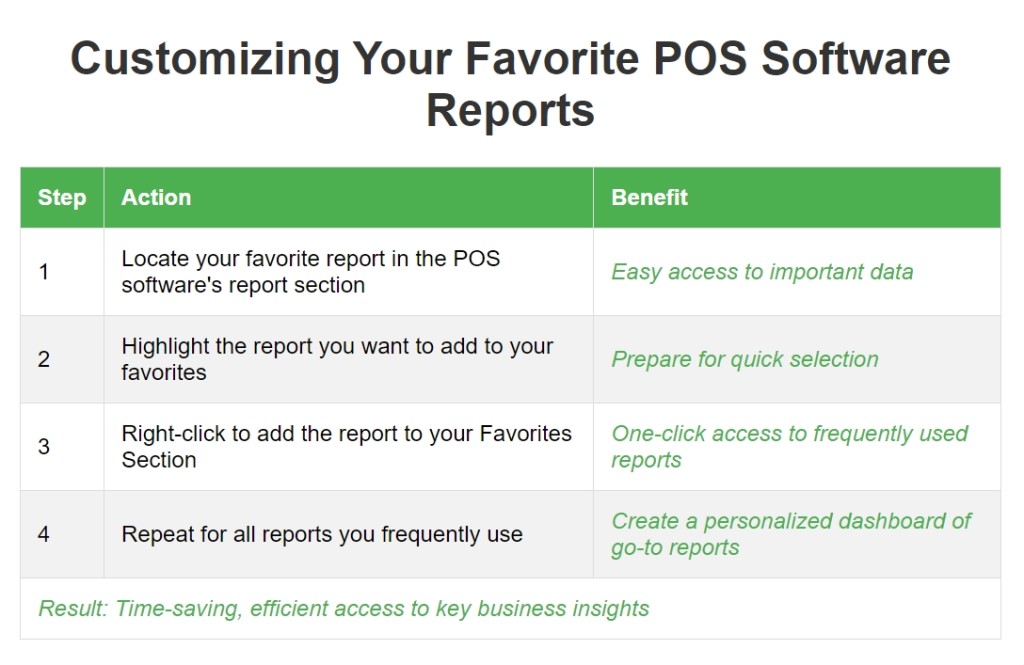
-Time-saving: No more sifting through menus to find the report you commonly use.

-Efficiency: It is much faster as you have them all in one spot.

Creating Your Smart List of Favourite Reports

Now, let's set up your personalised report dashboard. Trust me, it's simple.

Step-by-Step Guide

Creating Your Smart List of Favourite Reports


You've created a dashboard of your go-to reports in one convenient place.

The Beauty of the Favourites Section

Picture this:

-It's Monday morning.

-You've just walked into your shop.

-You want to check last week's sales figures.

Instead of clicking through multiple screens, you open your POS software, and there it is - your Weekly Sales Report in your favourites Section. It's that simple!

The beauty of this is that it grows and adjusts with you. Your favourite dashboard can change as you learn more and want different things. You're not just saving time; you're creating a tool that gives instant insights into your business performance.

Common ones that people put in there frequently are:

-Debtor trial balance

-Quick retail sales comparison

Conclusion: Your Business, Your Reports

Make sure your POS software is as you want it to be. Setting up your Favourites Section only takes a few minutes.

FAQ

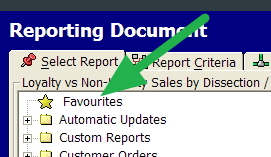
Q: Where do I find my Favourites folder?

A: See here at the green arrow.

Point of Sale Software favourite reports


Q: How do I add favourites to the toolbar?

A: Highlight the report you want to favourite and then right-click.


Reports for the end of financial year reporting 2024

POS SOFTWARE

The time has come again, and if you are feeling a bit nervous about the impending end of the financial year. Take a deep breath; if it makes you feel better, we are all doing this now. 

To get started, here's a checklist of the essential financial statements your accountant will need to produce your business accounting and tax preparation: profit and loss statements, balance sheets, and, if you use them, a cash flow statement. Please check with them what more they need and what dates they require these reports.

I suggest printing them all in detail, as you may need them to support your figures. Do not worry if it seems too much; I have never heard an accountant complain if they are given too much.

For the tax-savvy, review these reports and look for opportunities to write off any lousy stock or bad debts.  I suggest highlighting them so you can discuss with your accountant what they want to do with as these write-offs can potentially translate into tax deductions. 

Although many people do, our system does not need a unique backup for EOFY.

End-of-Financial-Year reporting

Sales Reports

These will give you the totals of your revenue streams. 

Stock Valuation

You will need to do this after you conduct your stocktake. This report will provide a comprehensive picture of your current inventory levels and values and will clearly show your inventory management.

Accounts receivable (debtors)

This report will give a total of your customers' debts and also highlight any unpaid invoices or outstanding balances. 

Accounts payable (creditors)

If your POS software tracks creditors, this report will give you the total amount of any outstanding payments you owe to suppliers or vendors.

The Webinar

Our team has prepared a video from a webinar that dives deep into the intricacies of end-of-financial-year reporting using our POS software. From dissecting each report to answering your burning questions, this webinar is a must-watch.

Remember, knowledge is power; these reports are vital to unlocking insights and opportunities. So, grab that coffee, roll up your sleeves, and let's conquer this financial year together!

Reporting and some helpful system functions for the End of the Financial Year.

Of course, if you need more help, give us a call.


Add new comment

Restricted HTML

  • Allowed HTML tags: <a href hreflang> <em> <strong> <cite> <blockquote cite> <code> <ul type> <ol start type> <li> <dl> <dt> <dd> <h2 id> <h3 id> <h4 id> <h5 id> <h6 id>
  • Lines and paragraphs break automatically.
  • Web page addresses and email addresses turn into links automatically.
CAPTCHA This question is for testing whether or not you are a human visitor and to prevent automated spam submissions. Image CAPTCHA
Enter the characters shown in the image.

Quickly find the information on a report

POS SOFTWARE

Finding Needles in Haystacks: Searching Reports in Your POS System

Shifting through lengthy reports searching for one piece of information can be a frustrating time-waster. But your POS system has a powerful tool to help you instantly find the exact data you need among thousands of lines. Let’s explore how to save heaps of time hunting for the critical information in the report.

Our POS Software includes robust search functions that index all text and data in the report. Rather than flipping through the pages, you can type a product name, date, or keyword into the search box.

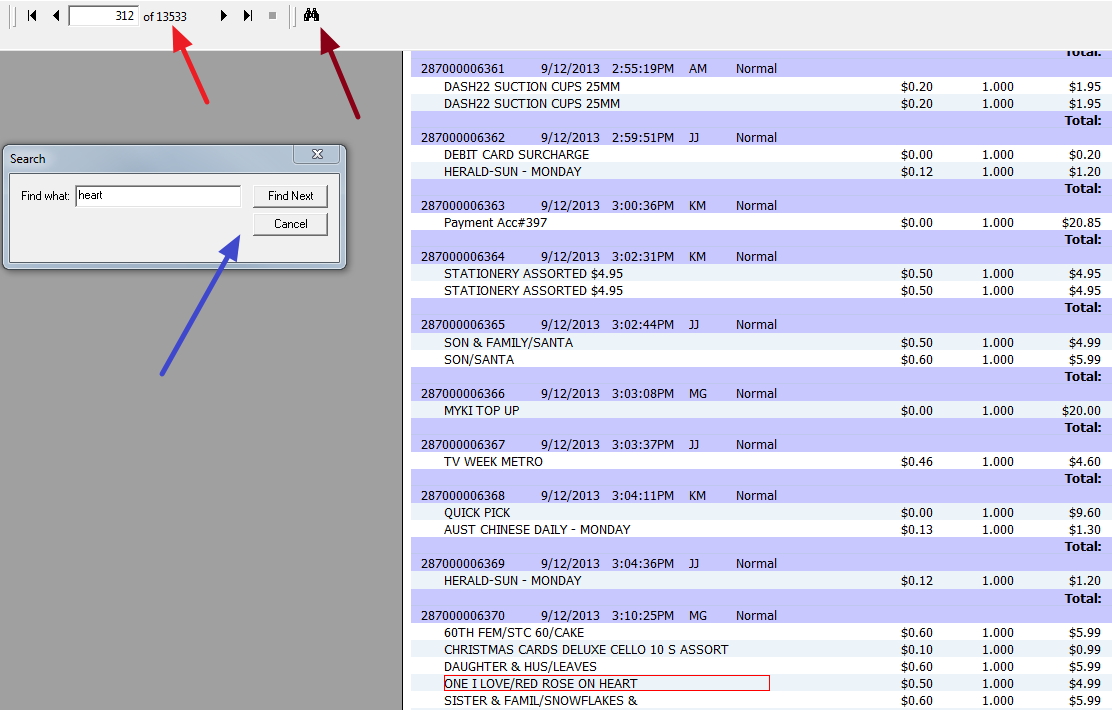
It will display the matching instance highlighted for you within less than a second. As you can see here, marked with a red arrow, this report they printed was 13,533 pages long. Finding one item can be tricky as there are so many pages. You do not have to search; you get our software search engine to search for you. So I press the search marked with a brown arrow.

Up pops a box shown with a blue arrow. You would typically put in here "Red rose on the heart", but for the sake of showing you the power of this search box, I pressed "heart" and pressed a few times "Find next" till I found the one I was seeking.

Of course, if you know the exact title, this will make searching faster and hide results that are not relevant to you now.


Tailor The Query To Your Needs

Entering more specific search terms will help surface the most relevant entries. In our example, typing "Red rose on the heart" would directly take you to the singular product without dozens of unrelated results about red products or rose items.

You can also filter by various attributes like:

  • Date
  • Product
  • Price
  • Sale Amount

Uncovering Hidden Insights In Seconds

Besides eliminating frustration, advanced report search empowers you to unlock hidden insights about your business. Rather than being limited by static reports, you can instantly investigate any detail that crosses your mind.

  • What were my top-selling items last Valentine's Day?
  • How many gift cards were purchased in December 2021?
  • What was the average transaction value for a specific brand last month?

Your answers are waiting at your fingertips!

The key is taking the time to familiarize yourself with the search functions available in your system. A few minutes of experimentation can save you hours over the long run.

Let Your POS System Shoulder The Reporting Burden

Leveraging the built-in tools in your POS solution will help you confidently base decisions on facts rather than gut instinct.

Add new comment

Restricted HTML

  • Allowed HTML tags: <a href hreflang> <em> <strong> <cite> <blockquote cite> <code> <ul type> <ol start type> <li> <dl> <dt> <dd> <h2 id> <h3 id> <h4 id> <h5 id> <h6 id>
  • Lines and paragraphs break automatically.
  • Web page addresses and email addresses turn into links automatically.
CAPTCHA This question is for testing whether or not you are a human visitor and to prevent automated spam submissions. Image CAPTCHA
Enter the characters shown in the image.

Debtor's trial balance

POS SOFTWARE


The Debtors Outstanding report is one of the most critical reports in a business. As a rule, it should be run at least once every month. What it does is print an outstanding balance for all your debtors.

This determines how your business is handling its debt collection. This is why banks and financial institutions commonly request this report.

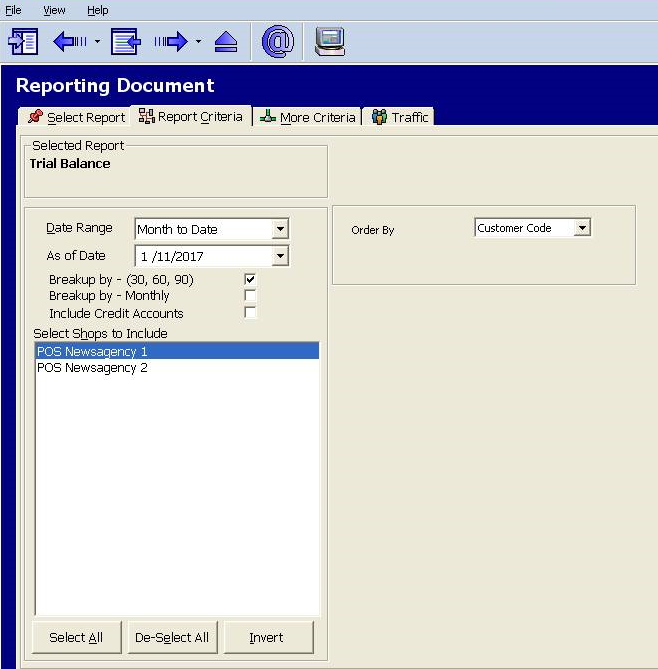
Looking at the image above, I think you will find it great that you can select any date (I chose a date in 2017, seven years ago, to show how flexible our POS System is) and display numbers for this date. This feature is handy.

This report is located in Registry Report > Client Trial Balance.

This is one of the most critical reports in a business. As a rule, it should be run at least once every month. What it does is print an outstanding balance for all your debtors.

This determines how your business is handling its debt collection. This is why banks and financial institutions commonly request this report.

Looking at the image above, I think you will find it great is that you can select any date (I chose four years ago) and display numbers for this date. This feature is handy.

This report is located in Registry Report> Client Trial Balance.

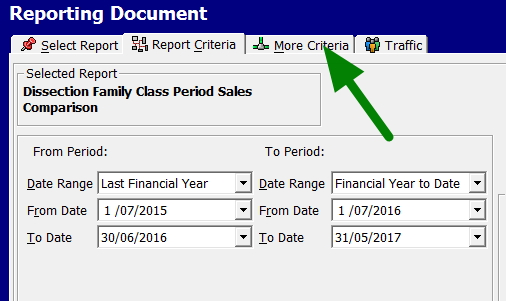
You also get the date range you want the breakup among the other options. In general, most people use months, but some prefer weeks. Others use a 4-week cycle because it gives an extra month in a year. It's up to you to decide. If you need more options, click the More Criteria tab.

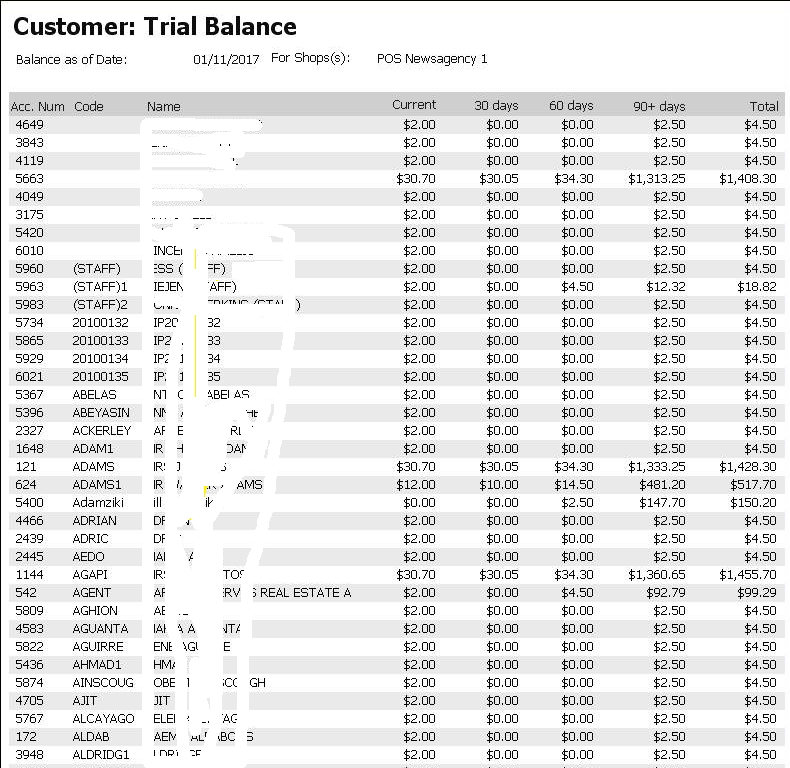
In the standard report, you will get something like


The name is drawn out here, but if you look at it, you'll initially see that almost everything is within 90 days. It would be a red flag if it's actual data, not many years ago.

What I find very useful is to look at it twice a month. This lets me stay on top of debt collection and spot any issues early. Monitoring the debt levels regularly is crucial for any business.

I highly recommend adding the Debtors Outstanding report to your regular reporting schedule. It can help avoid cash flow issues and keep your business financially healthy. Let me know if you have any other questions!

Add new comment

Restricted HTML

  • Allowed HTML tags: <a href hreflang> <em> <strong> <cite> <blockquote cite> <code> <ul type> <ol start type> <li> <dl> <dt> <dd> <h2 id> <h3 id> <h4 id> <h5 id> <h6 id>
  • Lines and paragraphs break automatically.
  • Web page addresses and email addresses turn into links automatically.
CAPTCHA This question is for testing whether or not you are a human visitor and to prevent automated spam submissions. Image CAPTCHA
Enter the characters shown in the image.

Max Your Shop profit with POS Solutions' Reporting Capabilities

POS SOFTWARE

Client in the shop

Introduction

I recently spoke with a client about the most important benefits of our POS system's reporting capabilities. Here they are:

What was liked

One of the standout features is the ability to manage inventory, process sales, and track customer information all in one place.

The reporting features offered by POS Solutions POS software are precious for any retail business. With the data gathered, you can better understand your customers and make informed marketing and stock decisions. For example, the system can collect customer data such as names, contact information, sale history, and buying patterns. Then the businesses can quickly set up and run loyalty programs. Also, special offers or targeted marketing campaigns can be made by analysing this data.

You are, furthermore, stocking the right products at the right time. It can predict future demand for particular products and adjust your inventory by tracking trends in sales. This will assist you in streamlining your stock levels and avoiding stock-outs, which can result in lost sales.

Inventory management is another valuable reporting feature of POS software. You can easily keep track of your stock levels and each product's movement with inventory reports. You won't have to worry about over- or under-stocking, which can result in wastage or missed sales opportunities. Moreover, you can utilise stock reports for bookkeeping, as your products are your resources.

Stock levels, sales by product, and stock movement over time are among the inventory reports offered by POS Solutions POS software. By analysing these reports, you can identify which items are selling quickly, which are slow-moving, and which are out of stock. You can use this information to make informed decisions about product pricing, ordering, and stock levels.

Also, POS software can assist you in monitoring your business's performance in real-time. By checking key performance indicators (KPIs) such as sales, profit, and customer traffic, you can identify problem areas. Then take action as needed. For example, if you observe a decrease in revenue from sales, you can investigate the reason for the decline. Then take measures to boost sales, such as launching a new product line or running a promotion.

Conclusion

POS Software was the best decision they made for their shop.

Executive summary

> POS Solutions POS software allows you to manage stock, process transactions, and track customer information from one spot.

> Analysing customer data is the crucial benefit of POS software. You can better understand your customer base and make informed marketing and stock management decisions with the information gathered.

> POS Solutions POS software can predict future demand for particular products and help adjust your inventory.

>Stock administration is a significant reporting feature of POS software. You can easily keep track of your stock levels and each product's movement with its inventory reports.

> You can utilise stock reports for bookkeeping, as your products are your resource.

> POS Solutions POS software can also assist you in monitoring your business's performance in real time. By checking key performance indicators (KPIs) like sales revenue, profit and customer traffic, you can identify areas of improvement. Then take action as needed. For example, if you observe a decrease in revenue from sales, you can investigate the reason for the decline and take measures to boost sales.

Comments

Hahaha Chatgpt is writing this stuff for you and it shows.

Actually, I write my stuff, then use Grammarly to check my grammarly to check the text, but the words and thoughts are all mine. Here look at GPTZeroX, probably the best detector for ChatGPT content; unlike many, it looks at both “perplexity” and “burstiness.”


====================================================

What is the accuracy rate of ZeroGPT?

After analyzing more than 10M articles and text, some generated by AI and others written by humans, we developed ZeroGPT's algorithm with an accuracy rate of text detection higher than 98%. Our AI text detector tool uses DeepAnalyse™ Technology to identify the origin of your text.

Our experiments are still ongoing, and our aim is to analyze more than 1B articles and text, and to converge to an error rate lower than 1%.

===============================================


Let us use it to test my writing.


You can access GPTZeroX by navigating to it here and testing it out. To demonstrate that it is my work, I have copied and pasted the above post


Having said that it's hard to prove anything now for stuff like this, here is the first chapter of the King James Bible, as you can see the biblical writers used ChatGPT by your logic.


And here is the first chapter of The Australian Constitution, tested for ChatGPT 

I would suggest that anyone using ChatGPT be very careful about using it as no one using it for blogging knows how Google will react to its use.


Add new comment

Restricted HTML

  • Allowed HTML tags: <a href hreflang> <em> <strong> <cite> <blockquote cite> <code> <ul type> <ol start type> <li> <dl> <dt> <dd> <h2 id> <h3 id> <h4 id> <h5 id> <h6 id>
  • Lines and paragraphs break automatically.
  • Web page addresses and email addresses turn into links automatically.
CAPTCHA This question is for testing whether or not you are a human visitor and to prevent automated spam submissions. Image CAPTCHA
Enter the characters shown in the image.

Achieving Growth and Profitability: The Importance of Measuring Sales Performance

POS SOFTWARE

Sales are the driving force behind a successful business. Measuring sales performance is critical for achieving growth and profitability. Yet, different companies need different systems to measure success. This is where POS Solutions Systems come in - with our customised sales systems tailored to each business's unique requirements.


Tailored Solutions for Unique Business Needs

At POS Solutions Systems, we understand that every business has specific needs. That's why we go above and beyond to provide tailored solutions that help you take control of your sales performance. Our customised sales systems provide seamless transaction processing. We also offer a range of advanced features to help you measure, track and evaluate sales performance.

Measuring Success with Advanced Metrics

Most point-of-sale (POS) systems fulfil basic transaction requirements but often fail to provide the necessary metrics to measure sales performance. Our customised solutions offer valuable insights into customer behaviour, preferences and sale patterns. By understanding your customer's needs and preferences, you can tailor your marketing and sales strategies to target your audience better. This results in increased sales and profitability.

Instilling Customer Confidence

In addition to tracking the number of sales and profit, our customised solutions also instil customer confidence by providing a seamless and secure payment process. Customers can feel confident that their payment information is safe. That they will receive accurate and timely receipts for their transactions. This level of customer confidence can help build long-term customer relationships, increasing loyalty and repeat business.

Conclusion

In conclusion, sales are the driving force behind a successful business. Measuring sales performance is crucial for achieving growth and profitability. At POS Solutions Systems, we recognise the unique needs of companies. We offer customised sales systems that provide seamless and measurable business performance. Our solutions let you take control and instil customer confidence. This helps you to build lasting relationships with your customers and achieve your business objectives.

So, if you're looking for a customised sales system that meets your business's needs, look no further than POS Solutions Systems.

Add new comment

Restricted HTML

  • Allowed HTML tags: <a href hreflang> <em> <strong> <cite> <blockquote cite> <code> <ul type> <ol start type> <li> <dl> <dt> <dd> <h2 id> <h3 id> <h4 id> <h5 id> <h6 id>
  • Lines and paragraphs break automatically.
  • Web page addresses and email addresses turn into links automatically.
CAPTCHA This question is for testing whether or not you are a human visitor and to prevent automated spam submissions. Image CAPTCHA
Enter the characters shown in the image.

EOFY Countdown is on: Your Questions Answered

POS SOFTWARE

We need to be ready to hit the ground running as preparing a business for the End Of the Financial Year (EOFY) can be daunting.

As a minimum, you need to do the tax stuff, but while doing this, you can do the management reporting too. This can be time-consuming, but luckily much of the information required is built into your POS Software. Before you go to the accountant, it is worthwhile to go to this webinar to review what reports our Point of Sale Software can produce. This will give you a feel of what you can supply to the accountant.

Here's a checklist of reports that you will need.

Sales reports
Stock Valuation (you will need to do this after your stocktake)
Customers Outstanding
Creditors Outstanding (if you are running creditors)
Subagents Outstanding (use only if applicable)

Click here for a webinar on the End of the Financial year reporting. It discusses in detail what reports our system can produce. 

Although not required from our software, I do recommend that you do make a special End of Year Backup to store in case you need to refer to it. The 30/of June this year is Thursday.

Add new comment

Restricted HTML

  • Allowed HTML tags: <a href hreflang> <em> <strong> <cite> <blockquote cite> <code> <ul type> <ol start type> <li> <dl> <dt> <dd> <h2 id> <h3 id> <h4 id> <h5 id> <h6 id>
  • Lines and paragraphs break automatically.
  • Web page addresses and email addresses turn into links automatically.
CAPTCHA This question is for testing whether or not you are a human visitor and to prevent automated spam submissions. Image CAPTCHA
Enter the characters shown in the image.

The End of the financial year is coming up.

POS SOFTWARE


For most of us, the End of the Financial Year (EOFY) is on the 30 June. For most businesses, it is a significant time. The immediate problem is super which has to be in by the 28 July. Then what we need to do is prepare by 31 October. If you do not use an accountant, you must lodge to the ATO by then but you often get some more time often with an accountant.

Here are some tips for now:

1) Make an EOFY sale. Get rid of as much stock as you can. Useless stock, if kept, generally goes into the stock figure at a wholesale value. That will increase your profit.

2) Review your debtors and creditors. Be careful here as if debts that need to be written off are not written off, it increases your profit. If creditors are written off, it increases your profits. As such most people write off the debtor now and the next financial year the creditor.

3) Review your records; are they up to scratch? If it is not, you can have with the ATO a real problem. I have seen problems with people whose POS systems has errors with the ATO.

4) Start planning a date for your stocktake. Although it is not an ATO rule, it is a valuable method of stock control. It's the best way of determining what stock has been lost to theft, spoilage or taken for personal use. I recommend that all businesses do a stocktake at least once a year. Also, without one, you may have a dispute with the ATO over your stock holding.

Good preparation is the key to stocktaking as it is a lengthy and often expensive operation. Typically a shop is looking at four (4) days of work.

We will be doing webinars to help you prepare soon for the EOFY.

"By failing to prepare, you are preparing to fail." — Benjamin Franklin.

Add new comment

Restricted HTML

  • Allowed HTML tags: <a href hreflang> <em> <strong> <cite> <blockquote cite> <code> <ul type> <ol start type> <li> <dl> <dt> <dd> <h2 id> <h3 id> <h4 id> <h5 id> <h6 id>
  • Lines and paragraphs break automatically.
  • Web page addresses and email addresses turn into links automatically.
CAPTCHA This question is for testing whether or not you are a human visitor and to prevent automated spam submissions. Image CAPTCHA
Enter the characters shown in the image.

How to get old information fast

POS SOFTWARE

This is something you will use a lot.

Continuously we get people, e.g. bookkeepers, bankers, etc. asking us for financial figures that are years old. So what people need from their POS Software is to find out what a client or the total clients owed on a nominated date. Say they wanted to know how much your customers owed you on 3/1/2018.

This is often a problem for people with other Point of Sale Systems. They have to keep special backups. Now they have to find the appropriate ones. Then load these backups to get the figures. Once they manage to supply this information as sure as day follows night, they get asked for other figures from other dates. This can be a problem if they have not kept the backups.

Here is a better way for you to do it.

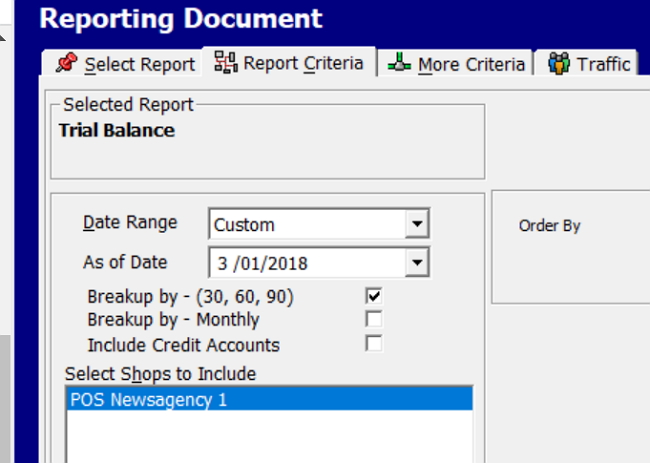
Go to the main menu> Register reports>Customers>Trial Balance.

Now select the date that was, in this case, we want 3/1/2018, so I put this date here.

Now comes out all the details.

If they pick another date for you, no worries put in those dates.

You have saved yourself a lot of work and time.


Add new comment

Restricted HTML

  • Allowed HTML tags: <a href hreflang> <em> <strong> <cite> <blockquote cite> <code> <ul type> <ol start type> <li> <dl> <dt> <dd> <h2 id> <h3 id> <h4 id> <h5 id> <h6 id>
  • Lines and paragraphs break automatically.
  • Web page addresses and email addresses turn into links automatically.
CAPTCHA This question is for testing whether or not you are a human visitor and to prevent automated spam submissions. Image CAPTCHA
Enter the characters shown in the image.

It is simple to make a top sales planogram for your shop

POS SOFTWARE

A picture is worth a thousand words.

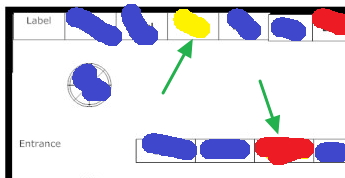
Now, this is what we are going to have. A diagram of your shop with your sellers listed as

Blue = Good

Yellow = Moderate to bad

Red = Very bad

blank = Zero

See how it visually shows the shops sales.


What is a planogram?

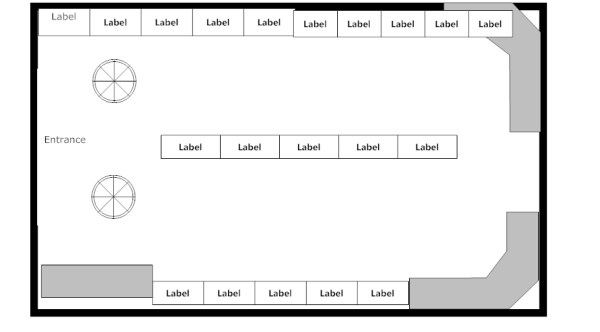
A planogram is a drawing of your store layout marked with the characteristics you wish visually to examine, e.g. sales, shoplifting, etc.

Drawing a blank map of your shop

First, you need to pace or measure out your shop. Make a rough draft of the shop on a sheet of paper with the figures marked. Now some here would prefer to use a computer to draw a blank map, but many still choose to draw manually on a big piece of cardboard. There are pluses and minus to both. In the final analysis, it does not matter.

Now, this is a blank map for a shop, I did.

Now save that map once you are happy with it or take some photocopies, and store them away. I promise you will use them once you get used to how it works for other analyses.

Now for our purposes, we will need two blank copies of these maps.

Now we need our data.

And it is easy in our point-of-sale system to get it.

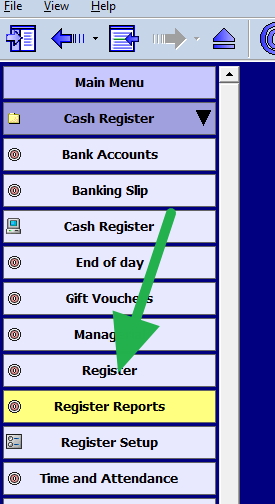
Go to Register reports.


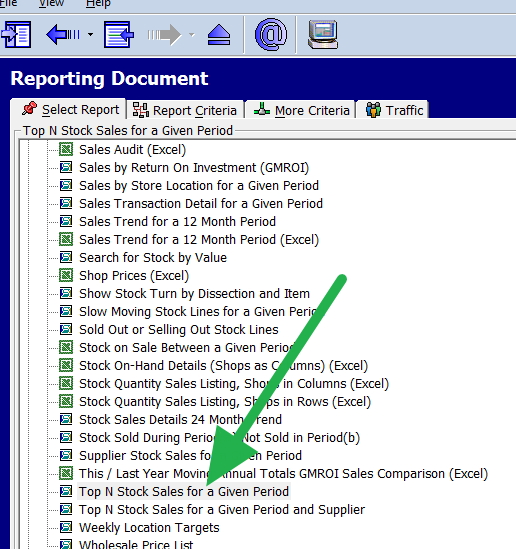
Now select "Top N Stock Sales for a Given Period"

Select a decent period. You would want here at least a couple of months.

Now select the top 100 items by quantity, and a report will come with the top sellers.

Now look through the report and draw a line. As a rule, I would mark at about the top 10. These are the ones you mark in blue on the blank map. The next 30 draw in yellow. The rest you mark in red. If you have a combination, show that on the diagram. It says something that a red seller, despite plenty of the drawcard of the blue, is doing average.

Now review your planogram.

Now once you digest this planogram, do the same procedure on a blank map for the top 100 items by profit. There should be less variation here.

Now review this planogram.

Once you get the hang of a planogram, it is about ten minutes to draw a planogram.

You will find once you get used to it that the use of planograms to plan your spaces yields many benefits. It will help you to maximise your shop sales.

Add new comment

Restricted HTML

  • Allowed HTML tags: <a href hreflang> <em> <strong> <cite> <blockquote cite> <code> <ul type> <ol start type> <li> <dl> <dt> <dd> <h2 id> <h3 id> <h4 id> <h5 id> <h6 id>
  • Lines and paragraphs break automatically.
  • Web page addresses and email addresses turn into links automatically.
CAPTCHA This question is for testing whether or not you are a human visitor and to prevent automated spam submissions. Image CAPTCHA
Enter the characters shown in the image.

Check the gross profit of your business.

POS SOFTWARE


Retail Gross Profit Margin

Sometimes you look at your gross profit give by the accountant somehow it does not look right. So what you want to do is analyse the details for yourself. 

Now there are a few reports that can help you.

Here is how you can calculate your retail store gross profit margin by department.

The best report to start is 

Register report> Sales Register> Dissection Sales / Profitability for a Given Period

For the time you are concerned about, select a suitable period. 

That report will give you a lot of detail by department, including the Quantity sold and %Profit. These are often an excellent sign of something wrong. 

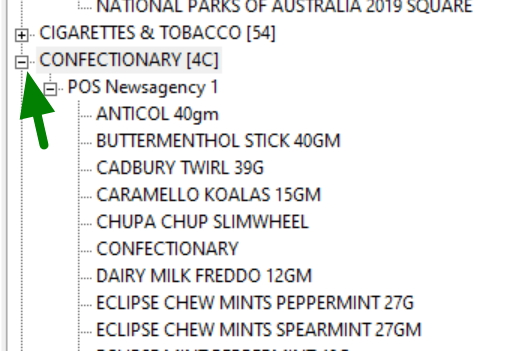
Once you find something you want to investigate, click on the left-hand side to see the green arrow above. Now select the shop. Then you will find the details of what is in every department. I find it very useful in real-time to go from one department to another while looking.

Happy hunting.

Add new comment

Restricted HTML

  • Allowed HTML tags: <a href hreflang> <em> <strong> <cite> <blockquote cite> <code> <ul type> <ol start type> <li> <dl> <dt> <dd> <h2 id> <h3 id> <h4 id> <h5 id> <h6 id>
  • Lines and paragraphs break automatically.
  • Web page addresses and email addresses turn into links automatically.
CAPTCHA This question is for testing whether or not you are a human visitor and to prevent automated spam submissions. Image CAPTCHA
Enter the characters shown in the image.

Does your POS Software give you your stats in real-time?

POS SOFTWARE

Our Point Of Sale Software gives you all the stats in real-time now instantly!

What is happening?

What your staff are doing?

What your customers are buying?

How much profit are you making now?

Info like this is what modern stores need.

With our point of sale software, you can instantly find out these questions and much more. Here I will show you how to set up and use your location dashboard in your shop.

This form of analysis is Same-store sales. Every major retailer uses it that I know.

Here I will show you how our system can do it.

In a shop, each part of your shop has different value to the business. On the front, a product to justify itself needs outstanding sales. While in the back, often much lower sales results are acceptable. So what professional marketers do is set a budget for each area of the shop. Then they compare usually monthly sales in that area. Anything dramatically up and down raises flags.

So let us do it!

First, we set it up.

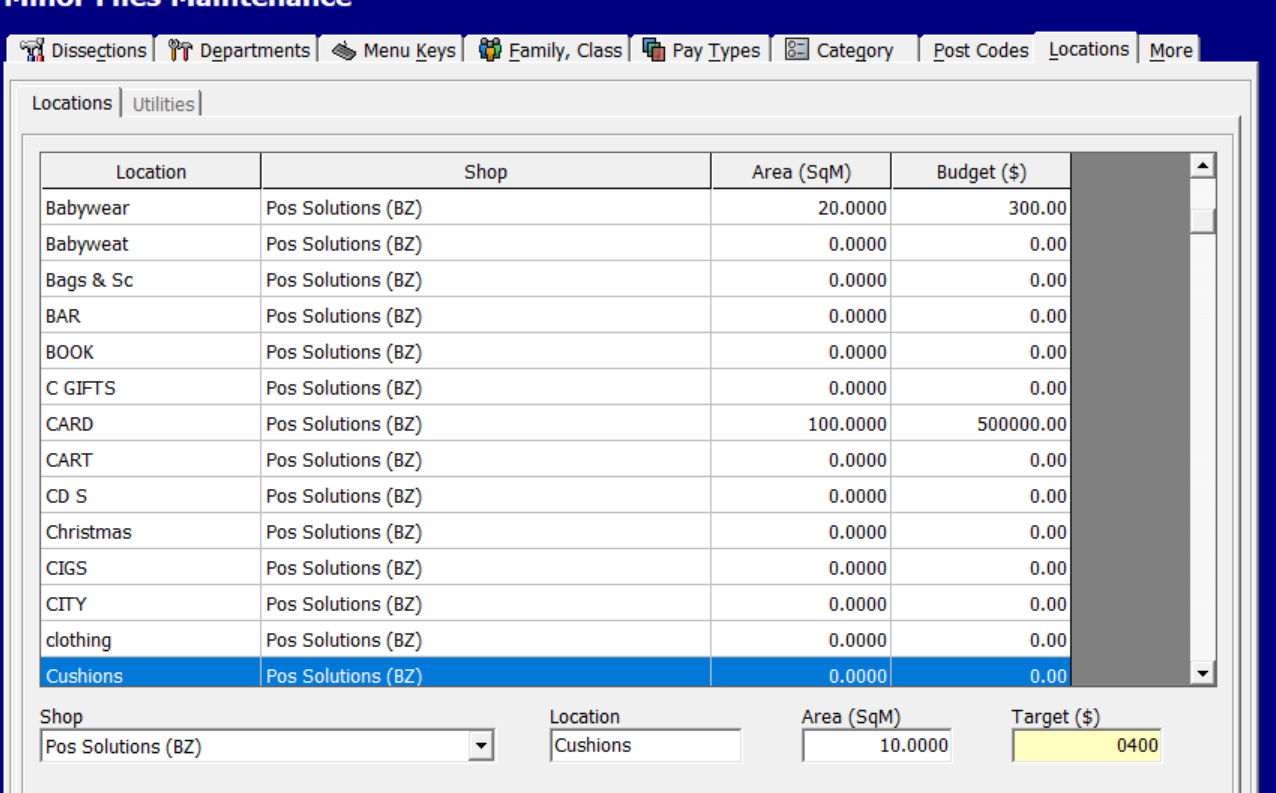
Look around your shop and divide the shop into locations.

Generally, a shop is divided into departments already. As this is logical I suggest using the departments.

Now check that your stock has location entered. If not, do not worry. It is easy to do.

Go to stock systems> stock editing> stock level editing.

Give all your stock a suitable location.

For each location, you adopt, calculate the area it takes up, which is simple to do by pacing it out. Now decide what weekly budget you would like for each location to have. This the end of day figures will tell you.

Now go to system maintenance> Dissection maintenance > Location

Put in the location and give it a weekly budget.

Now when you go to register reports>stock>weekly location targets.

You will get a detailed report full of comparisons for each location.

This is something you can use.

Put an end to guessing in your business and make fact-based decisions.

Add new comment

Restricted HTML

  • Allowed HTML tags: <a href hreflang> <em> <strong> <cite> <blockquote cite> <code> <ul type> <ol start type> <li> <dl> <dt> <dd> <h2 id> <h3 id> <h4 id> <h5 id> <h6 id>
  • Lines and paragraphs break automatically.
  • Web page addresses and email addresses turn into links automatically.
CAPTCHA This question is for testing whether or not you are a human visitor and to prevent automated spam submissions. Image CAPTCHA
Enter the characters shown in the image.

See this Webinar on your End of Financial year reporting

POS SOFTWARE

Click here for a webinar on End of the Financial year reporting from your point of sale software. It discusses in detail

Sales reports
Stock Valuation (you will need to do this after your stocktake)
Customers Outstanding
Creditors Outstanding
Subagents Outstanding (use only if applicable)

Although not required from our software, I do recommend that you do make a special End of Year Backup to store in case you need to refer to it. The 30/June this year is Wednesday.


Add new comment

Restricted HTML

  • Allowed HTML tags: <a href hreflang> <em> <strong> <cite> <blockquote cite> <code> <ul type> <ol start type> <li> <dl> <dt> <dd> <h2 id> <h3 id> <h4 id> <h5 id> <h6 id>
  • Lines and paragraphs break automatically.
  • Web page addresses and email addresses turn into links automatically.
CAPTCHA This question is for testing whether or not you are a human visitor and to prevent automated spam submissions. Image CAPTCHA
Enter the characters shown in the image.

How we are using data mining to help our clients?

POS SOFTWARE

What it does is give you a different perspective in your business, the computer perspective. 

Data mining is a formal process used by organisations to look into their information. Using it they can get helpful information about what is happening. They do this by using software to look for patterns in their data. Using it, businesses have learnt more about their customers. They can use it to develop more effective marketing strategies. For example, to increase sales or decrease costs. 

It is not a manual process but is computer-generated, which is both a blessing and a curse. Doing it depends on your POS system having effective data collection and processing. Something, as far as I know, we are the only ones in our market space that have a computer system that can do that? We then often add extra information like the local weather over the period, COVID lockdowns, economic data from the government surveys, etc. Then we use a specialised data mining software package. This brings these figures together and analyses the statistics. 

Generally, this takes over two weeks to do it. This is because it often fails, and we have to redo it. It also often gives misleading results. Please do not believe that its results are always right. It usually takes a few attempts to narrow it down on the information where it can help. The results are sometimes interesting but not useable. Sometimes there is little you can do even if you know a pattern. 

Also, when you do it, you get results like above. It is the sort of stuff that even experts find hard to understand. 

So it has in the past proved quite valuable. It often identifying shopping trends by understanding the purchasing behaviour of your existing customer. It can often increase sales and customer loyalty as are predicting the market. I also find it is good at finding cross-selling opportunities in our clients' shops. This often allows our clients to increase the efficiency of their business.


If you want to give it a try, let me know. We do offer it to our clients *FREE*.

Add new comment

Restricted HTML

  • Allowed HTML tags: <a href hreflang> <em> <strong> <cite> <blockquote cite> <code> <ul type> <ol start type> <li> <dl> <dt> <dd> <h2 id> <h3 id> <h4 id> <h5 id> <h6 id>
  • Lines and paragraphs break automatically.
  • Web page addresses and email addresses turn into links automatically.
CAPTCHA This question is for testing whether or not you are a human visitor and to prevent automated spam submissions. Image CAPTCHA
Enter the characters shown in the image.

A quick first-level approximation to determine your shrinkage

POS SOFTWARE


A first-level approximation of determining your shrinkage

You would be getting a theoretical margin in a perfect world. In the real world, goods get stolen, lost, damaged, mispriced, discounted, etc.

Checking your theoretical margin

It is often easy to get as your supplier will usually provide you with this figure. The first point to do is check this 

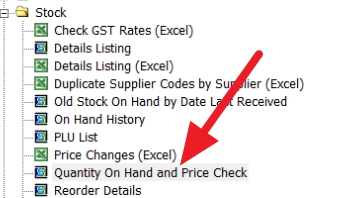
Go to register resports> Stock > "Quantity On Hand and Price Check."

The report will show you your margins. 

Actual results.

Here is how we get the actual result.

(Stock sold) = (Sales) x (1-theoretical margin%/100). 

Now for each department, 
(Perpetual stock) =(opening stock)-(closing stock)+ (purchases)

This is a first-level approximation, so we assume that your stock ordering is good. Thus we make (opening stock)=(closing stock) and so use the following formula.

The (Perpetual stock) =(Purchases)

What you want to compare is the difference.

(Difference percentage) = (1-((Stock sold)/(Perpetual stock))x100%

As a rule, about .5% is a typical figure.

If it is much more than that, it is considered severe. 

Plugin the figures from your totals report and purchases for the last twelve months. Now for each department calculate the (Difference percentage)

It should take you less than 10 minutes to do once you get the hang of it.

This will quickly tell you if there is a problem and, if so, the extent and where the problem is now. 


Add new comment

Restricted HTML

  • Allowed HTML tags: <a href hreflang> <em> <strong> <cite> <blockquote cite> <code> <ul type> <ol start type> <li> <dl> <dt> <dd> <h2 id> <h3 id> <h4 id> <h5 id> <h6 id>
  • Lines and paragraphs break automatically.
  • Web page addresses and email addresses turn into links automatically.
CAPTCHA This question is for testing whether or not you are a human visitor and to prevent automated spam submissions. Image CAPTCHA
Enter the characters shown in the image.

Make a marginal goal of 1% improvement per year

POS SOFTWARE

Before you think it is of little help 1%, let me show you have much of even improvement per year this can make.

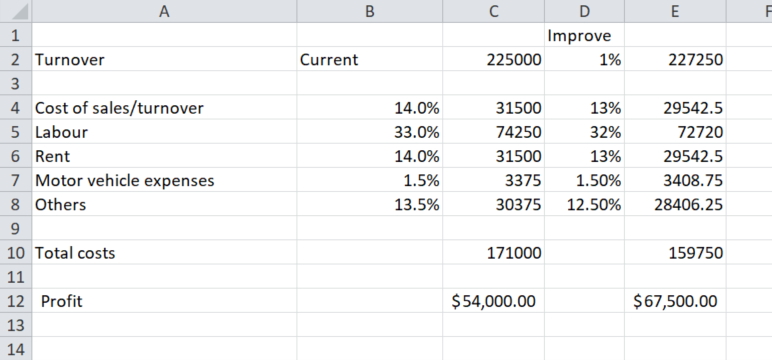
Going to the ATO benchmark study they give what I consider the best benchmarking figures for businesses in Australia today free.

Now I picked a hairdresser shop just because it is something most of us can get our head around. Then picked the average for everything. I put it into an excel spreadsheet and then made a new column for 1% improvement.

Bottom line: I got a 25% increase in profit. That is pretty impressive.

How do we do this 1% improvement?

Well, there is an excellent quote in management theory. I learnt that "what gets measured is what gets improved." What we need to do is measure over time. This will tell you where you are, and how you got there. Then how you go compared to others. Then see where you are going if nothing changes. 

And with our POS Software, you have the tool.

Look through our reports for ones that you like, here are some key metrics, I suggest you start with.  

Total Profit
Most would say this is the most critical metric in a shop today. It is the primary method used by people to determine their business value.

Number of Customers (Customer Traffic)
The number of customers in your shop is the most straightforward metric for your retail business. 

Average profit by the sale  
This is always an exciting measure in a shop. Are people that buy more or not?  

Basket size
This shows how productive you are in the shop.

Often these are linked. For example, if you see profit per sale is down by basket size is up. Well, you are pushing the wrong products, or maybe you are overdoing discounts. 

Try giving your business a standard to measure itself for continual improvement.


Add new comment

Restricted HTML

  • Allowed HTML tags: <a href hreflang> <em> <strong> <cite> <blockquote cite> <code> <ul type> <ol start type> <li> <dl> <dt> <dd> <h2 id> <h3 id> <h4 id> <h5 id> <h6 id>
  • Lines and paragraphs break automatically.
  • Web page addresses and email addresses turn into links automatically.
CAPTCHA This question is for testing whether or not you are a human visitor and to prevent automated spam submissions. Image CAPTCHA
Enter the characters shown in the image.

How to find your stock that are on incorrect sale?

POS SOFTWARE

One trick often used by bargain hunters is looking for items that were on sale years ago. Sometimes the old codes still work, and so they can pick up a bargain. Occasionally in bargain sites, someone will pop up noting such a deal. That is how I got a good price on some software. 

The same trick can occur in your shop. You may have items that were on sale long ago in your system. This is because someone has incorrectly not taken out the deal. So these old prices are still active despite the sale being over long ago. This is a big problem if you import from a supplier their prices directly. 

It was often not picked up as you had no stock, but this stock if it creeps back into your shop and you have an old sale price.  

You can use many reports to find these items, but we have a special report to combat this. It is specially designed to find such items. 

Go to register reports>Stock>Stock on Sale between a given period

Put in the relevant detail and see what you have.

I suggest that you do run it now. Rarely, it does not find anything.


Add new comment

Restricted HTML

  • Allowed HTML tags: <a href hreflang> <em> <strong> <cite> <blockquote cite> <code> <ul type> <ol start type> <li> <dl> <dt> <dd> <h2 id> <h3 id> <h4 id> <h5 id> <h6 id>
  • Lines and paragraphs break automatically.
  • Web page addresses and email addresses turn into links automatically.
CAPTCHA This question is for testing whether or not you are a human visitor and to prevent automated spam submissions. Image CAPTCHA
Enter the characters shown in the image.