Our Point Of Sale Software gives you all the stats in real-time now instantly!
What is happening?
What your staff are doing?
What your customers are buying?
How much profit are you making now?
Info like this is what modern stores need.
With our point of sale software, you can instantly find out these questions and much more. Here I will show you how to set up and use your location dashboard in your shop.
This form of analysis is Same-store sales. Every major retailer uses it that I know.
Here I will show you how our system can do it.
In a shop, each part of your shop has different value to the business. On the front, a product to justify itself needs outstanding sales. While in the back, often much lower sales results are acceptable. So what professional marketers do is set a budget for each area of the shop. Then they compare usually monthly sales in that area. Anything dramatically up and down raises flags.
So let us do it!
First, we set it up.
Look around your shop and divide the shop into locations.
Generally, a shop is divided into departments already. As this is logical I suggest using the departments.
Now check that your stock has location entered. If not, do not worry. It is easy to do.
Go to stock systems> stock editing> stock level editing.
Give all your stock a suitable location.
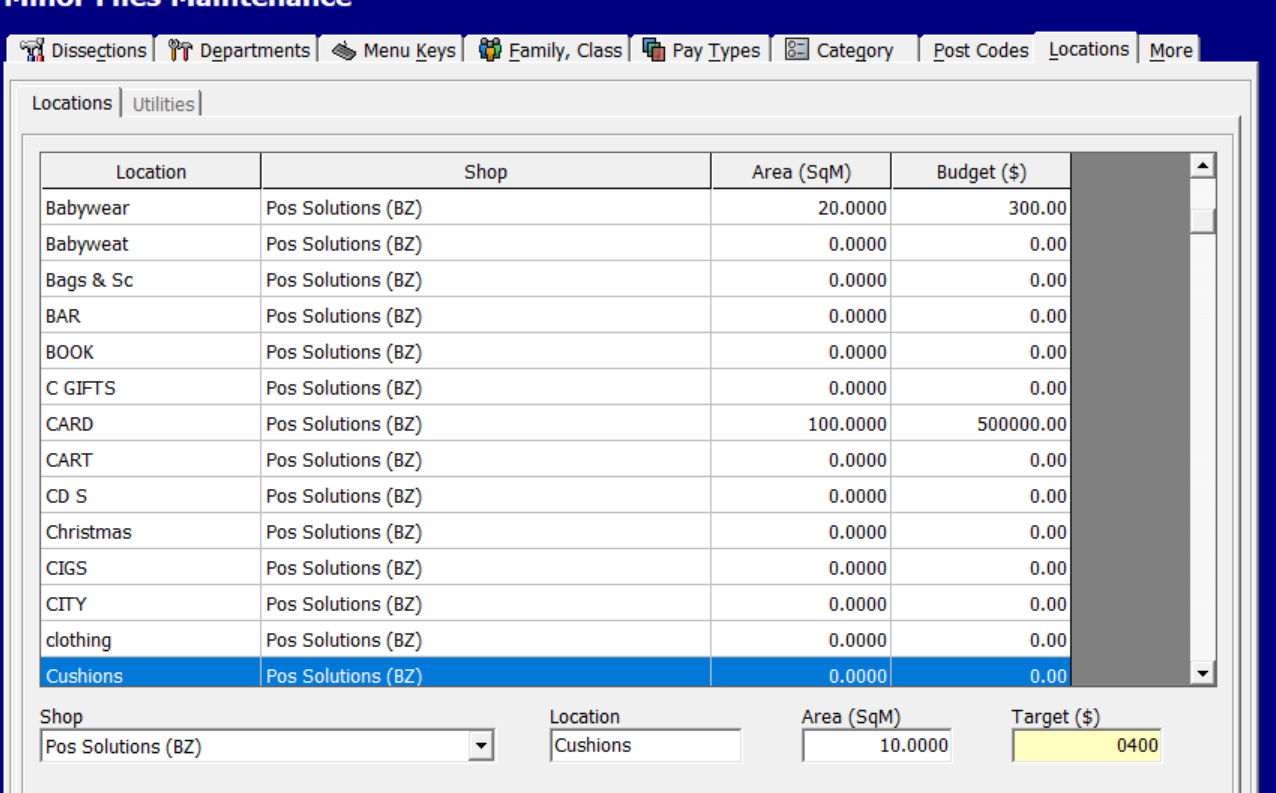
For each location, you adopt, calculate the area it takes up, which is simple to do by pacing it out. Now decide what weekly budget you would like for each location to have. This the end of day figures will tell you.
Now go to system maintenance> Dissection maintenance > Location
Put in the location and give it a weekly budget.
Now when you go to register reports>stock>weekly location targets.

You will get a detailed report full of comparisons for each location.
This is something you can use.
Put an end to guessing in your business and make fact-based decisions.


