
A picture is worth a thousand words.
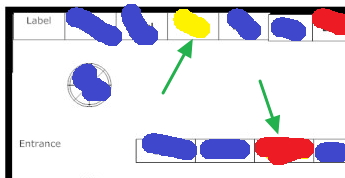
Now, this is what we are going to have. A diagram of your shop with your sellers listed as
Blue = Good
Yellow = Moderate to bad
Red = Very bad
blank = Zero
See how it visually shows the shops sales.
What is a planogram?
A planogram is a drawing of your store layout marked with the characteristics you wish visually to examine, e.g. sales, shoplifting, etc.
Drawing a blank map of your shop
First, you need to pace or measure out your shop. Make a rough draft of the shop on a sheet of paper with the figures marked. Now some here would prefer to use a computer to draw a blank map, but many still choose to draw manually on a big piece of cardboard. There are pluses and minus to both. In the final analysis, it does not matter.
Now, this is a blank map for a shop, I did.
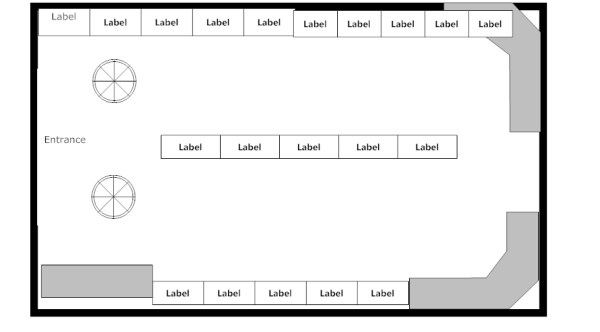
Now save that map once you are happy with it or take some photocopies, and store them away. I promise you will use them once you get used to how it works for other analyses.
Now for our purposes, we will need two blank copies of these maps.
Now we need our data.
And it is easy in our point-of-sale system to get it.
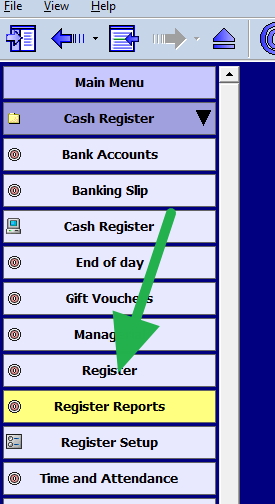
Go to Register reports.
Now select "Top N Stock Sales for a Given Period"
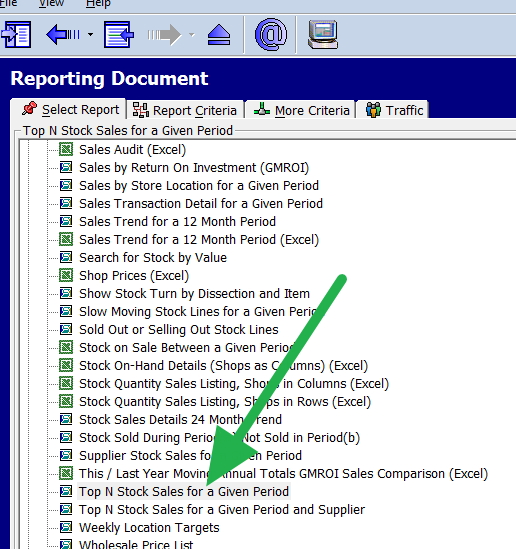
Select a decent period. You would want here at least a couple of months.
Now select the top 100 items by quantity, and a report will come with the top sellers.
Now look through the report and draw a line. As a rule, I would mark at about the top 10. These are the ones you mark in blue on the blank map. The next 30 draw in yellow. The rest you mark in red. If you have a combination, show that on the diagram. It says something that a red seller, despite plenty of the drawcard of the blue, is doing average.
Now review your planogram.
Now once you digest this planogram, do the same procedure on a blank map for the top 100 items by profit. There should be less variation here.
Now review this planogram.
Once you get the hang of a planogram, it is about ten minutes to draw a planogram.
You will find once you get used to it that the use of planograms to plan your spaces yields many benefits. It will help you to maximise your shop sales.

