Point of Sale Software

Here are some Articles from the Blog Subject - Retail inventory -

Save Time and Money with Automated Inventory

POS SOFTWARE

stock in a shop

This is part of a proposal I will be releasing for POS Solutions on the benefits of using  Automated Inventory, I hope you like it. 

Keeping on top of inventory levels and movements is one of the biggest challenges retailers face. Manual approaches to tracking stock and purchase orders can be extremely time-consuming and prone to human error. This often leads to lost sales from empty shelves, bloated inventory carrying costs, and unnecessary labour expenses.

Fortunately, POS Solutions provides powerful automated inventory management tools that save retailers time and money.

Real-Time Visibility into Inventory

POS Solutions integrates directly with inventory databases, pulling out real-time stock count data. This gives retailers now their inventory levels across their entire business as stock quantities are updated automatically as items are sold.

Accurate and Automated Purchase Orders 

With an accurate inventory picture, POS Solutions can automatically generate purchase orders as stock levels fall below predetermined or computer-estimated focus AI levels. This prevents out-of-stocks while removing the guesswork from ordering. Orders are precisely matched to demand, avoiding overstocking.

Reduced Out-of-Stocks and Better Customer Service

POS Solutions significantly reduces missed sales opportunities from out-of-stocks by monitoring inventory in real-time and allowing reordering when stock gets low. Customers get reliable access to the products they want.

Optimized Inventory Levels and Carrying Costs

Granular analytics within POS Solutions provide insights into fast versus slow-moving inventory. This allows retailers to optimise stock levels in each location. Excess stock can easily be transferred to meet demand elsewhere in the business. The result is leaner inventories across the board. 

Decreased Labor Costs

Automated inventory management with POS Solutions eliminates employees' need for frequent manual cycle counts and stocktakes. Retailers save on labour while focusing staff on more value-added tasks.

Insights into Shrinkage and Theft 

Unusual inventory activities are flagged by POS Solutions, allowing potential shrinkage and theft issues to be spotted in real time. Problems can be addressed before inventory losses grow.

Streamlined Supplier Relationships

Automated purchase orders and inventory tracking via POS Solutions improve supplier communication and coordination. Deliveries arrive when needed.

The Bottom Line

Automating inventory management via POS Solutions delivers game-changing benefits for retailers, including reduced out-of-stocks, lower carrying costs, optimized inventory, decreased labour spending, and minimised inventory shrinkage.

By implementing POS Solutions stock control, you can manage your stock more efficiently, improve customer service, and boost profitability.
Add new comment

Restricted HTML

  • Allowed HTML tags: <a href hreflang> <em> <strong> <cite> <blockquote cite> <code> <ul type> <ol start type> <li> <dl> <dt> <dd> <h2 id> <h3 id> <h4 id> <h5 id> <h6 id>
  • Lines and paragraphs break automatically.
  • Web page addresses and email addresses turn into links automatically.
CAPTCHA This question is for testing whether or not you are a human visitor and to prevent automated spam submissions. Image CAPTCHA
Enter the characters shown in the image.

Maximising your Products with Visuals

POS SOFTWARE

Step-by-Step Guide to Showcasing your Products with Pictures

If you have a customer display, customers like to see a picture of the item as it is scanned. The image is superior to writing as it is much easier to see than writing on the screen. Additionally, it is helpful because others in the queue can observe what people are purchasing from you at a distance. This is a simple way of making you look more professional, increasing sales and improving your service.

To do this, you need to add photos to your stock items. It is simple, and I will show you how to do it here. If this all will sound hard, it is not, and it is a valuable skill you will find helpful outside of work.


Preparation

You only need to do some things in the shop; the top 50 items are often enough to start. Once you get going, you can always get more.

So what we need are our top 50 items to start. You know it already, but if you want a computer listing, do the following.

Follow this, and in this instant, you can precisely know, track, and control your top-selling products in real time. 

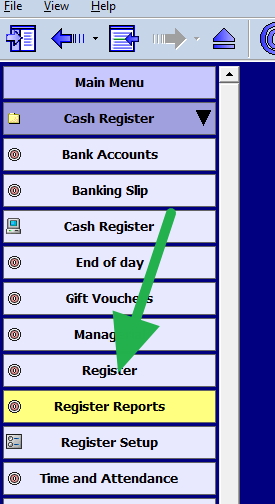
Go to Register reports.


Report of stock maintenance

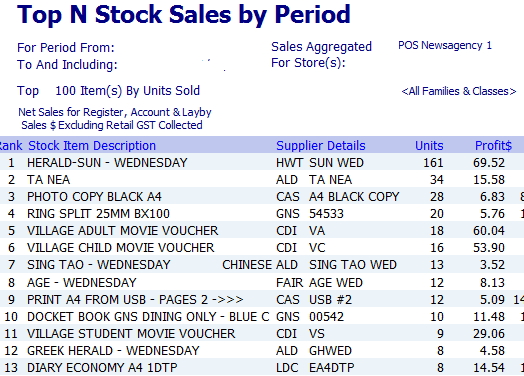
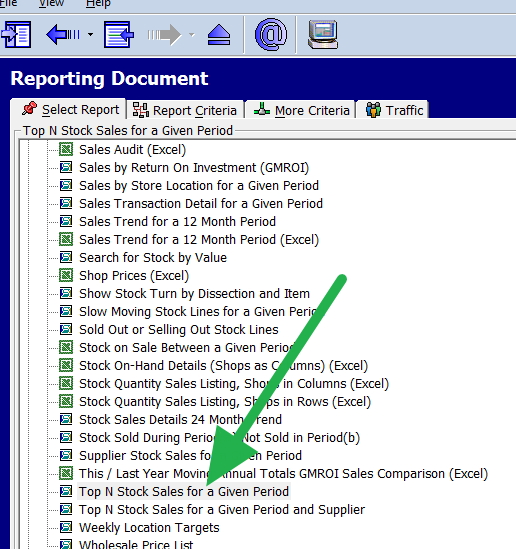
Now pick "Top N Stock Sales for a Given Period." I suggest the last two months.


Top selling report in a retail shop


Now you have your hot list, which took less than a minute to do.

A bonus here is that you will see items you may find much more interesting here.

Getting the photos

It is not hard, and over the years, I have changed my mind about the quickest and easiest way to get the photos.

Ask your supplier (Old method)

You can ask your suppliers.

Pros: These photos are often perfect.

Cons:

> Each supplier handles only a small number of your products. There are many suppliers to ask.

> It's a hassle to find the right person in an organisation to ask

> Surprise they do not have everything

> It takes ages to get it

> Often, the photo is in strange computer formats that are hard to use.

Now, this is the big problem. The pictures are not yours. I have spoken to several suppliers on my client's behalf and told them they could use them verbally, but only some have agreed in writing. Even if they put it on paper, which is rare, clauses are attached.

Royalty-free places on the web

There are many royalty-free places on the web where you can get them.

For example, there are many royalty-free places on the web to get them.

https://pixabay.com/en/photos/

https://unsplash.com/

A picture of an apple for POS Software

I grabbed a picture of an apple from one of them.

Pros: Good photos

Cons:

> The big problem is, besides some standard groceries like the apples above, it's hard to get branded items. No one will be happy if, for butter, you show a genetic picture or, even worse, an image of butter from another brand.

> It takes time to find the images

>Legal problems might arise.

Get a professional photographer.

Pros: Good pictures

Cons:

> costs.

> Lack of flexibility

Do it yourself.

Having done it a few times, I have found it quick and easy to do with a modern smartphone. Modern smartphones are more than good enough.

You will need a tripod. A decent one is about $30. If you do not have one, well, get one before starting.

You are looking at an hour and a half of work.

Set-Up

A bathroom works great if it has a window to the sun. Set up a table in the room, put some cardboard on the table, and you are off.

If you want something better, you will need a reading lamp, a large cardboard box, oven paper, white cardboard, the smartphone and then watch this youtube explaining how to do it.

Set up your photo area. Remember that in photography, lighting is crucial, especially when taking pictures of small things. Now take pictures of a few sample items. You must ensure your items are well-lit and do not have shadows.

Set the image setting on the camera.

Adjust the image settings on your smartphone until you achieve a good visual output. While professionals may prefer manual settings due to their experience and knowledge, amateurs with limited knowledge will find the automatic mode more suitable for their needs. So I suggest using an automatic setting here.

Activate burst mode's automatic setting on your smartphone.

When you are happy with the pictures you get, you can start photographing your items.

Preparing your stock items

It works better with two people. One positions the items, cleans and takes the pictures, and the other collects them, bringing them in and then putting them back. 

Before the photo is taken make sure your items are clean and free of fingerprints and dust.

Taking the picture.

It's time to take the pictures.

> Put the item in; while doing this, consider its position. Most items are best shown from an angle.

> Take about five to ten shoots per item.

Putting in your computer

There are services like google photos that will automatically move the images from your smartphone to your computer. Use one such service. After they are in your computer, review each stock item and select the best one while deleting the others. Avoid taking excessive time deciding which to pick. If it is hard to determine, it does not matter which one you choose for this purpose.

Adding the Photos to Your Stock Items

Now that your pictures are prepared, it's time to add them to your stock items. 

Now call up the item you wish to add the photo, for example, here oranges

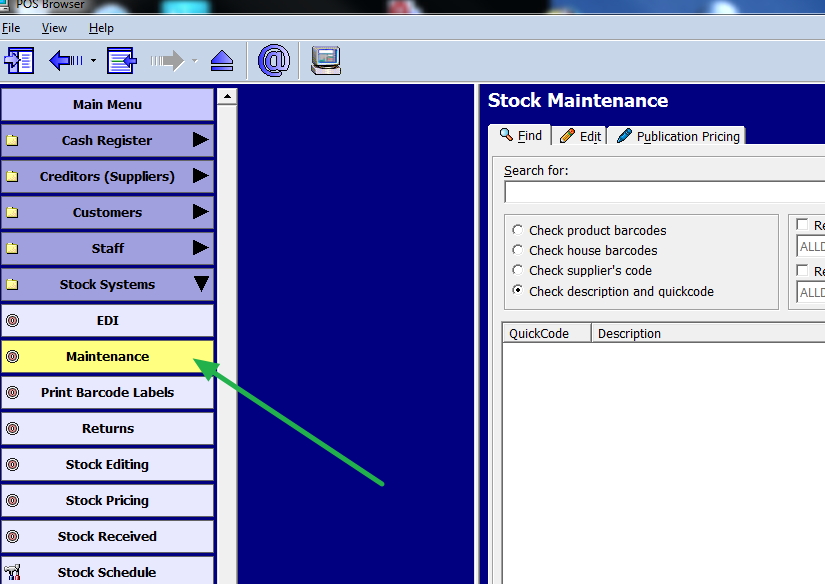
Now go into stock maintenance.

stock maintenance


Now call up the item, here it will be oranges


Calling up stock item

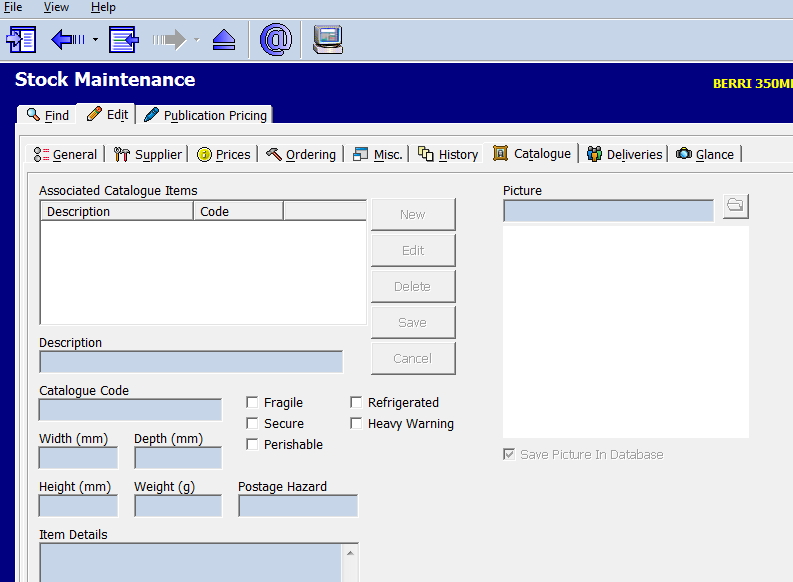
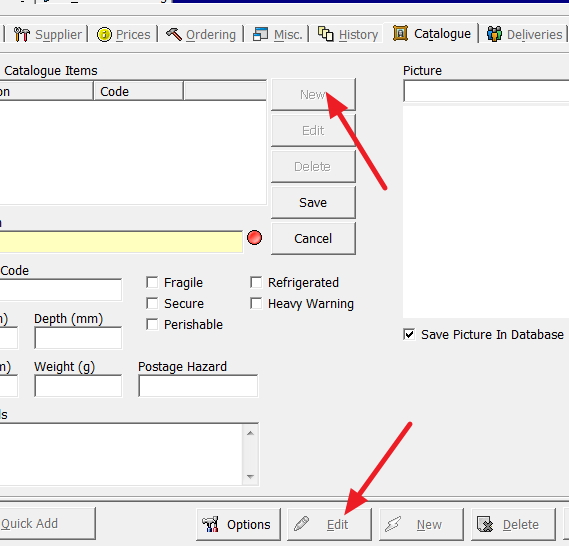
After that, go to the catalogue section, click edit and then new to add a new photo.


stock mantenance

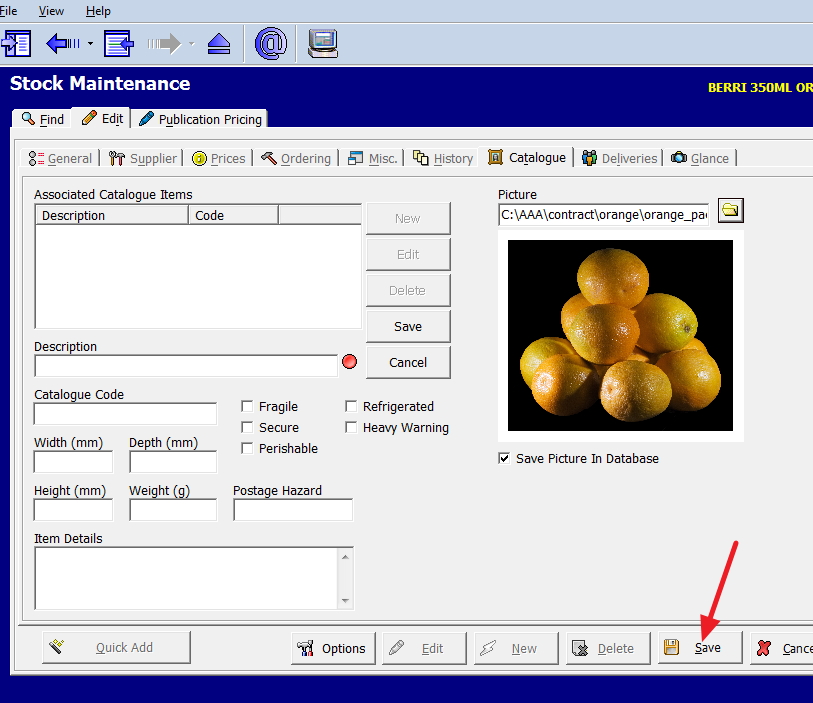
Then select my image and save it. 

Adding image to retail stock

Now you have attached the image.

Conclusion

Including pictures of your stock items can help improve the appeal of your listings and boost sales. You can easily take great photos and add them to your stock items by following these steps and tips.

Enjoy your photography!

Add new comment

Restricted HTML

  • Allowed HTML tags: <a href hreflang> <em> <strong> <cite> <blockquote cite> <code> <ul type> <ol start type> <li> <dl> <dt> <dd> <h2 id> <h3 id> <h4 id> <h5 id> <h6 id>
  • Lines and paragraphs break automatically.
  • Web page addresses and email addresses turn into links automatically.
CAPTCHA This question is for testing whether or not you are a human visitor and to prevent automated spam submissions. Image CAPTCHA
Enter the characters shown in the image.

How to build your Basket Size? 

POS SOFTWARE

How to build your Basket Size? 

The retail basket size is the average number of items in a customer's transaction.

Study shows that the largest 20% of shopping baskets on average generate 50% of unit sales, and 40% of dollar revenue. That is huge if you think about it. What it shows is that the size of the basket accounts for much of a company's profits, so knowing this metric is essential. So we will discuss methods for increasing retail basket size and how to measure it.

Theory of basket size

Getting customers to buy something is a big business problem. In practice, they often do buy more after deciding to make one sale. The second item is often less competitive because the customer evaluates the first product more than the second. Often to the retailer, there is more money in the addon sales than the core.

Time

Getting customers to spend more time in your shop is one of the most important ways to increase the size of their baskets. Studies show consumers make more purchases the longer they spend in a store. For example, people in superstores buy more because they spend more time in them. One way to get customers to spend more time in your store is to offer in-store experiences. Bunning, for example, with their free classes on hardware, knows what they are doing.

Products for the size of a basket

You need items that sell with other products. What you will see are these products in your companion reports. Consider these recommendations.

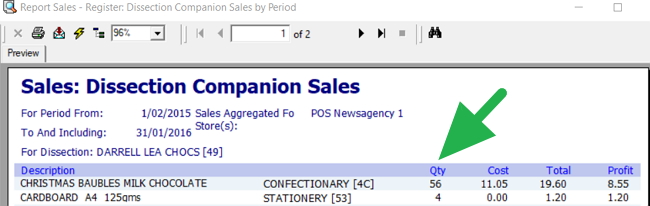
Navigate to Sales-Register > Dissection Companion Sales by Period in your POS software.

Increase your basket size with impulsive items.

Try looking for the items that sell more than other products. You should ensure that these items are prominently displayed. To maximize and increase sales, majors often show these items in many locations under different categories. For example, a Christmas Card can be shown in the Card department and the Christmas section.

Finding these Companion items

In your POS software

Go to Sales-Register > Dissection Companion Sales by Period.

Look for items that sell well with other departments. It is beneficial as it can help you select a product to display near a department prominently. This is a well-known method of increasing incremental sales that all majors use.

You take items that sell well with that department and place them in that department's area. There is nothing wrong with a good seller having a few spots in the shop. 

Also, moving products by type rather than supplier, e.g. moving some of the chocolates other businesses produce closer to Darrel Lea Chocolates, could result in many more sales. Darrel Lea might not like that, but...

As you can see here by the green arrow, the books should be close to the stationery.

I've noticed that phone recharges in tourist areas help sell other products and are worth handling despite having little value in themselves.  

Now, if you've found these things, you should look at the following:

Design of the store

If the layout and design of your store are clear, it will be easier for customers to find what they're looking for. This makes it more likely that they will buy something. Goods that are impulsive sales should be visible. 

Promotions.

Retailers can use sales and promotions to get customers to buy their products if they have the right ones. Increasing the size of a customer's basket encourages repeat purchases.  

Product bundling

By making bundles of products, retailers create more customers who will buy more.

Measuring the Size of a Retail Basket

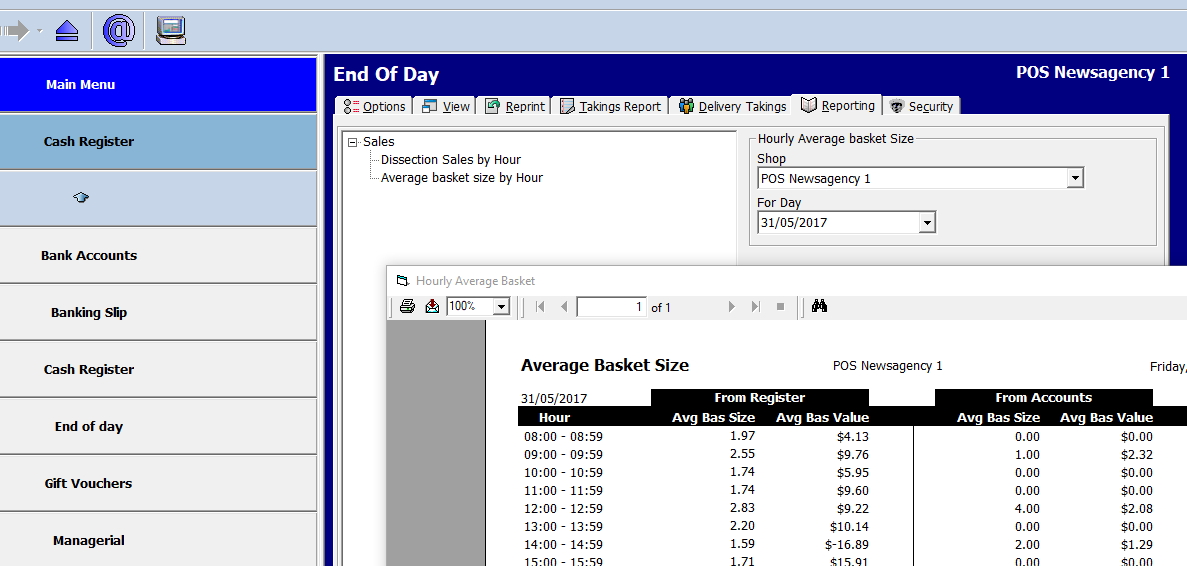
Navigate to End of Day > Reporting > Average Basket Size by Hour (picture)

Understand and optimize your basket size with data analysis

Then enter a date to observe how the size of a retail basket changes depending on the time of day in your store. The time can be significant. Find out why?

We've broken it down by account and retail sales; Generally, we observe larger basket sizes in account sales. 

Conclusion

You can increase the basket's size in various ways.  The most apparent benefit of increasing a basket's size

> It increases total revenue and sales. Profit rises in tandem with higher sales. 

> Customers are more likely to return to a store and make more purchases if they spend more money with you. This also increases their lifetime value as a customer. 

> If you are shipping, you reduce the costs of handling transactions, shipping, and logistics by increasing the basket size.

Add new comment

Restricted HTML

  • Allowed HTML tags: <a href hreflang> <em> <strong> <cite> <blockquote cite> <code> <ul type> <ol start type> <li> <dl> <dt> <dd> <h2 id> <h3 id> <h4 id> <h5 id> <h6 id>
  • Lines and paragraphs break automatically.
  • Web page addresses and email addresses turn into links automatically.
CAPTCHA This question is for testing whether or not you are a human visitor and to prevent automated spam submissions. Image CAPTCHA
Enter the characters shown in the image.

How to Check Your Items, No Longer On Sale, but Marked Down

POS SOFTWARE

How to Check Your Items, No Longer On Sale, but Marked Down

The problem

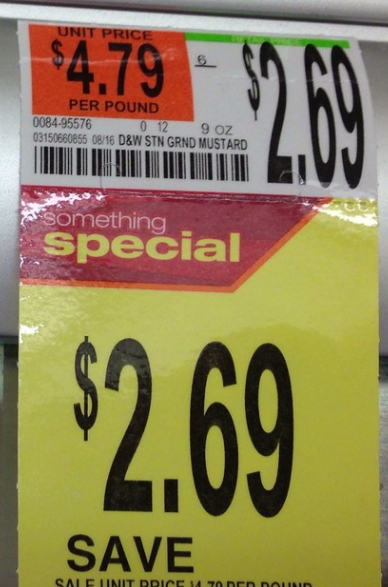
Today many of you currently have items with discounts for the Christmas season that are still marked down on the label; however, this sale has ended. It can be challenging to ensure that you have found all these markdown items. As such, you risk

>either selling those items at the wrong price

>or arguing with a customer about why you are not honouring that price on the label.

Shoppers use this popular technique to get bargains, looking for items wrongly marked. Bargain sites frequently mention such shops with wrongly marked merchandise.

To stop this, you must identify those items and change their prices on the label to avoid this problem.

Most stores have to go through their inventory and physically check whether all the items are still on sale, a very time-consuming task, but you have a better way.

Finding Out-of-Sale Items

You can run a unique report from your point-of-sale system showing all the off-sale items. Check these items off; doing this will save time and money.

Go to the stock system > Select Sales Promotion here.

A screenshot for the option to select for a report showing items on sale and their sale prices


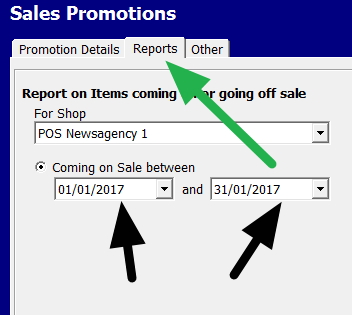
Select reports (marked with Green)

A screenshot for a report showing items on sale and their sale prices


Now select the dates marked with the black arrows, and you'll see a report of all items with a sales price change in this period. Next comes a list of all items affected for you to investigate

Conclusion

Doing this can ensure that you are selling your items at the correct prices and avoid confusion and pricing errors over items going off sale.

Add new comment

Restricted HTML

  • Allowed HTML tags: <a href hreflang> <em> <strong> <cite> <blockquote cite> <code> <ul type> <ol start type> <li> <dl> <dt> <dd> <h2 id> <h3 id> <h4 id> <h5 id> <h6 id>
  • Lines and paragraphs break automatically.
  • Web page addresses and email addresses turn into links automatically.
CAPTCHA This question is for testing whether or not you are a human visitor and to prevent automated spam submissions. Image CAPTCHA
Enter the characters shown in the image.

How to Calculate Shrinkage in your shop

POS SOFTWARE


Staying on top of your stock is critical to loss prevention. Hopefully, you have finalised your stocktake so we can calculate your retail shrinkage.

So why not do so now?

This is how you do it in less than four (4) minutes.

1) We need what your computer had for the value of your stock before the stocktake. If your point of sale is up to date, print out a report of your stock valuation before starting the stocktake. If you do not trust the figure in your point of sale software, then you can, or your accountant can give you an estimate. This is the (Perpetual stock value).

2) This comes from your stocktake and is the value of the stock you had after the stocktake. Your point of sale software will have this figure once you enter the stocktake figure in the stock valuation report. (Physically Counted Inventory Value)

3) What are the total sales of your shop less the non-stock items? E.g. if you sell touch gift cards, these are not stock items, so take them off your overall sales figure. Your total report should be able to give you this figure which is your (Sales of stock products)

4) Value of the damaged goods you counted. (Damaged stock value)

Now please do the following calculation.

Shrinkage% = ((Perpetual stock value)-(Physically Counted Inventory Value))/(Sales of stock product) x 100%

A familiar figure here is about 1.4%, but it varies generally between 0.1% and 6%.

Now what you may also want to look at is your damaged goods, these have a different story, and they can be a compelling story to tell too.

Damaged% = (Damaged stock value)/(Sales of stock product) x 100%

Once you get these figures, you will know how bad a problem you face. Now we know what we are looking at in my next post on this subject, I will discuss how to analyse further. To see how we can reduce this problem. It's a tradeoff as your loss prevention strategy must reduce loss without impacting the customer shopping experience.

Add new comment

Restricted HTML

  • Allowed HTML tags: <a href hreflang> <em> <strong> <cite> <blockquote cite> <code> <ul type> <ol start type> <li> <dl> <dt> <dd> <h2 id> <h3 id> <h4 id> <h5 id> <h6 id>
  • Lines and paragraphs break automatically.
  • Web page addresses and email addresses turn into links automatically.
CAPTCHA This question is for testing whether or not you are a human visitor and to prevent automated spam submissions. Image CAPTCHA
Enter the characters shown in the image.

Handling Premium Chocolate consider their Shelf Life

POS SOFTWARE

There is a trend in our market space for our clients to look into premium chocolates.

When handling premium chocolates, you need to consider their shelf-life. Preference should be given, if possible, to these longer shelf-life items. Although many long shelf-life chocolate products are suitable for gifting all year round, many are not.

But if you are serious about this market, you need some shorter shelf-life fresh chocolates. A fundamental problem here is white chocolate. It only has a low shelf-life. The darker, the better.
The biggest problem is that, over time, white stuff appears on the chocolate, which makes them unmarketable.

It's a problem as, unfortunately, these chocolates do not enjoy being refrigerated! Putting them in the drink fridge, which sort of works for mass-produced chocolates, is not a good idea for premium chocolates. If you must, use a wine chiller. 

Ensure your chocolate counter is out of the sun. That it is in a cool, dry area as the moisture ruins the packaging.

Fortunately, checking your premium chocolates, which should be done regularly, is straightforward.


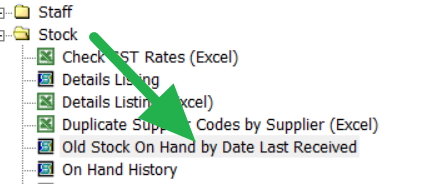
Go to register reports> Stock> Old Stock on hand.

Now pick the department and get a list of when this stock arrived and the quantity you have on hand.  I am sure you will find some are very old; these must go.

Add new comment

Restricted HTML

  • Allowed HTML tags: <a href hreflang> <em> <strong> <cite> <blockquote cite> <code> <ul type> <ol start type> <li> <dl> <dt> <dd> <h2 id> <h3 id> <h4 id> <h5 id> <h6 id>
  • Lines and paragraphs break automatically.
  • Web page addresses and email addresses turn into links automatically.
CAPTCHA This question is for testing whether or not you are a human visitor and to prevent automated spam submissions. Image CAPTCHA
Enter the characters shown in the image.

GMROI: How you Make More Sales

POS SOFTWARE

Regardless of how experienced you are at overseeing stock, there will be times when goods do not move. Some of your goods are sitting on your racks using up cash that should have been used stock that moves.

This is where in retail the  'Gross Margin Return On Investment - GMROI' is used in retail. It tells you exactly how much gross profit you make on each item in your shop over time. It tells you how successful your goods are in turning into cash.

The formula for calculating GMROI:

GMROI = Annual Sales $ / (Average Inventory at cost) x (Gross Margin %)

Say, for example, an item A sales per annum are $54.00 with a margin of 30%. You have generally about 40 that cost $0.2, so your holding cost is $8.

So the GMROI = ($54 = yearly sales)/($8 holding cost) x (30% Gross margin) = 2.0

So you are getting $2.00 for every $1.00 you invested in this item.

Nice figure, but looking at all the goods in the shop, it is a big job to calculate this for every site.

No, it is not, as your POS System can do it automatically.

What we do is give you the figures. This allows you to see where every dollar invested in your stock inventory be at its greatest productive?

This allows you to look at another item, B which has sales per annum are $78 with a margin of 20%. You generally have about 30 that cost $0.21, so your holding cost is $6.30.

So the GMROI of item B = ($78 = yearly sales)/($6.30 holding cost) x (20% Gross margin) = 2.5

So this retailer is getting $2.50 in back for every $1.00 invested in this item.

The retailer would have done better over the past year in pushing item B even though the gross margin was less.

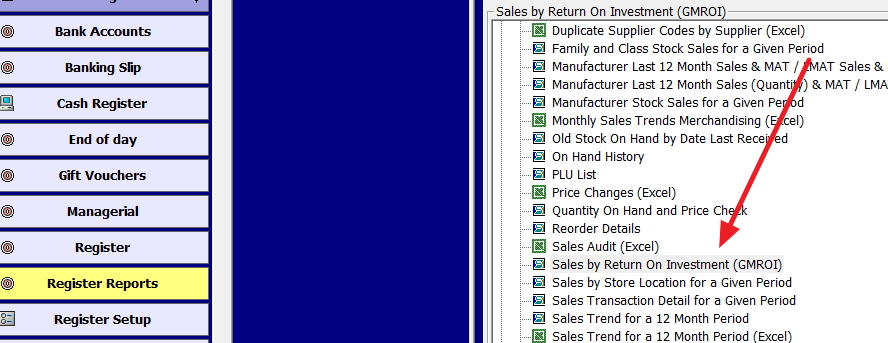
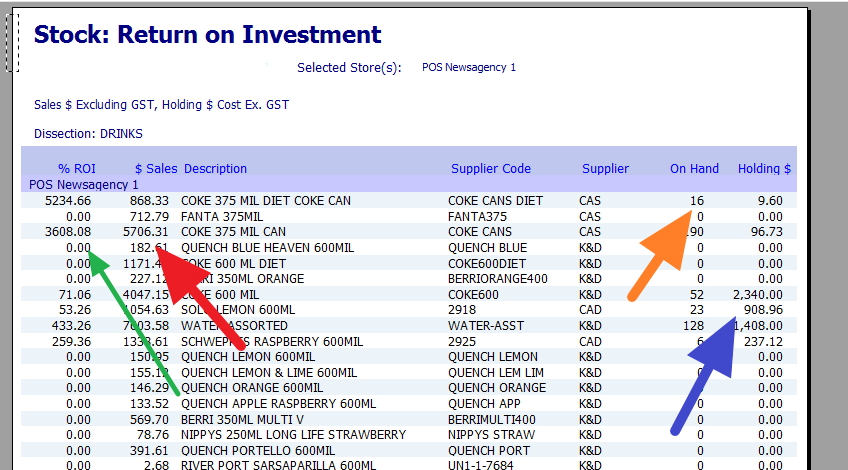
If you go to Register reports, you will see an item "Sales by return on Investment (GMROI)" marked in red here.


Now select an appropriate date range and department to consider. A year is suggested to give the report enough time to provide meaningful figures.

Now I used here five years, to show, in practice use 12 months.

This report can be beneficial.

The green shows the GMROI%.

The red items are the traps, the GMROI is high, but there are few sales.

In Orange, you will see the stock on hand; this is a quick way of verifying that you have enough stock.

The amount it costs you now, the holding costs are displayed in blue.

Altogether, this is an informative report. You will find the summary at the end is loaded with some instrumental figures to examine. Also checkout Diet Coke - High GMROI and low stock holding.

The GMROI recipe is not a magic fix. What it is, is a straightforward computation that assists you with deciding on your stock.

Why are you waiting? Give it a try now?


Add new comment

Restricted HTML

  • Allowed HTML tags: <a href hreflang> <em> <strong> <cite> <blockquote cite> <code> <ul type> <ol start type> <li> <dl> <dt> <dd> <h2 id> <h3 id> <h4 id> <h5 id> <h6 id>
  • Lines and paragraphs break automatically.
  • Web page addresses and email addresses turn into links automatically.
CAPTCHA This question is for testing whether or not you are a human visitor and to prevent automated spam submissions. Image CAPTCHA
Enter the characters shown in the image.

How to use your data to win more sales!

POS SOFTWARE

This is 


Retail Analytics 

Years ago, by looking into their retailers' sales, the music industry found the best policy was to concentrate on their top 40 sales items.  

This is where the action is. 

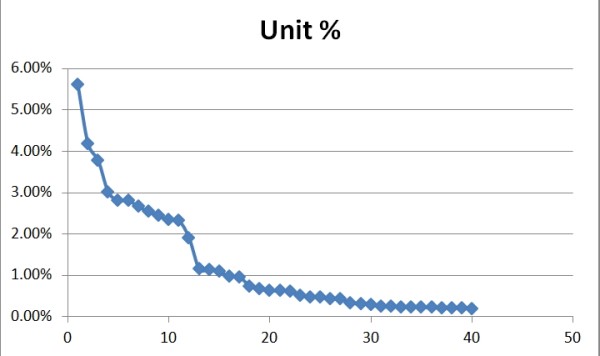
Over the years, when looking at my clients' retail information, this great advice. Here is an example: a client of ours has sold 15181 different items in their shop over the past three years. See, when you look at the sales, once you are about the top 40 items, the sales are getting very close to 0%. There is a lot of profit past the 40th item but few people are coming for those items. 

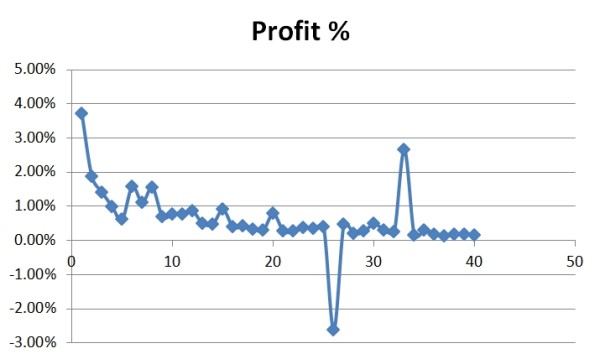
When I decided to look at the profit that we're making from these 40 items, I found this, 

I do not think that remarkable and almost 25% of the shop's profit came from these 40 items.

As you can see, the profit between items varies, although the basic pattern follows sales. Note the item in negative. Much of the product had to be sold below cost to get rid of it.

What has proven very effective is leaving best-sellers where they are now as they sell well there. Then put some in a best-selling area at the central point of the customer's vision. Some have a few best-selling regions. This is to group products with similar attributes next to each other.

Now how do we find these 40 top best selling items? Well, it's easier than you think.

How to Perform Profit Analysis for Your Retail Business

Go to Register reports.


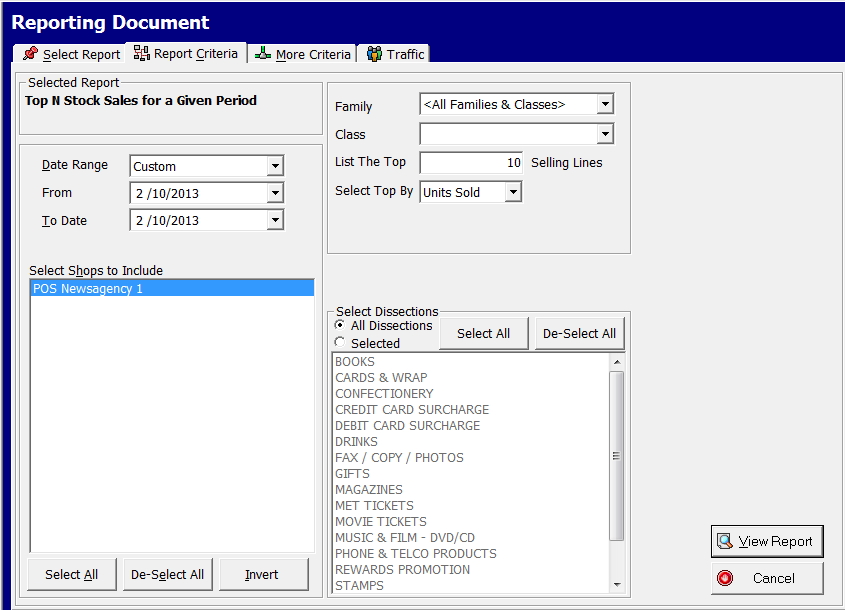
Now select "Top N Stock Sales for a Given Period."

Now the following comes up.

For example, I will select a day, but you usually would put in a year, now select a department.


Outcomes a report with the top sellers.

Now, you're set!  

Make a few best-selling areas. Now every month, you run this report. Then move a few items to the best-selling areas and take out some.

Add new comment

Restricted HTML

  • Allowed HTML tags: <a href hreflang> <em> <strong> <cite> <blockquote cite> <code> <ul type> <ol start type> <li> <dl> <dt> <dd> <h2 id> <h3 id> <h4 id> <h5 id> <h6 id>
  • Lines and paragraphs break automatically.
  • Web page addresses and email addresses turn into links automatically.
CAPTCHA This question is for testing whether or not you are a human visitor and to prevent automated spam submissions. Image CAPTCHA
Enter the characters shown in the image.