
Regardless of how experienced you are at overseeing stock, there will be times when goods do not move. Some of your goods are sitting on your racks using up cash that should have been used stock that moves.
This is where in retail the 'Gross Margin Return On Investment - GMROI' is used in retail. It tells you exactly how much gross profit you make on each item in your shop over time. It tells you how successful your goods are in turning into cash.
The formula for calculating GMROI:
GMROI = Annual Sales $ / (Average Inventory at cost) x (Gross Margin %)
Say, for example, an item A sales per annum are $54.00 with a margin of 30%. You have generally about 40 that cost $0.2, so your holding cost is $8.
So the GMROI = ($54 = yearly sales)/($8 holding cost) x (30% Gross margin) = 2.0
So you are getting $2.00 for every $1.00 you invested in this item.
Nice figure, but looking at all the goods in the shop, it is a big job to calculate this for every site.
No, it is not, as your POS System can do it automatically.
What we do is give you the figures. This allows you to see where every dollar invested in your stock inventory be at its greatest productive?
This allows you to look at another item, B which has sales per annum are $78 with a margin of 20%. You generally have about 30 that cost $0.21, so your holding cost is $6.30.
So the GMROI of item B = ($78 = yearly sales)/($6.30 holding cost) x (20% Gross margin) = 2.5
So this retailer is getting $2.50 in back for every $1.00 invested in this item.
The retailer would have done better over the past year in pushing item B even though the gross margin was less.
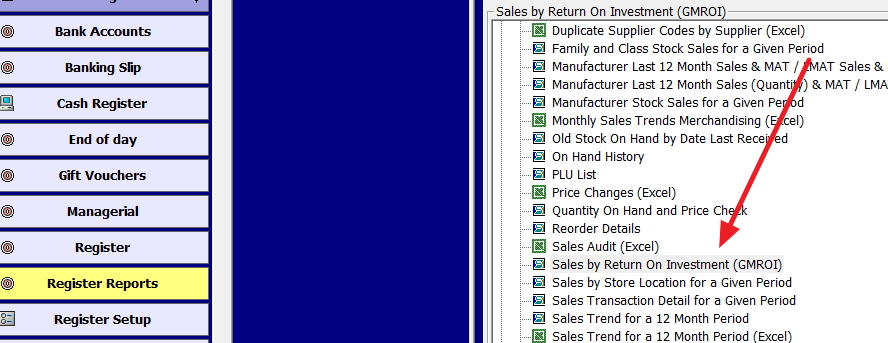
If you go to Register reports, you will see an item "Sales by return on Investment (GMROI)" marked in red here.
Now select an appropriate date range and department to consider. A year is suggested to give the report enough time to provide meaningful figures.
Now I used here five years, to show, in practice use 12 months.
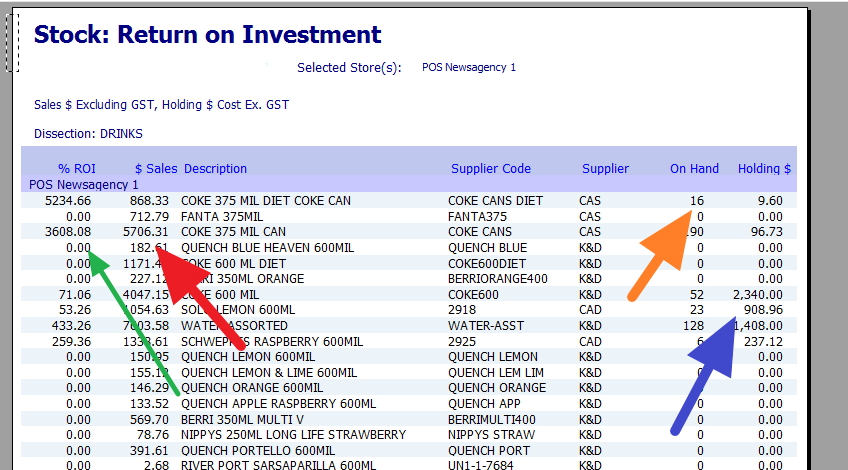
This report can be beneficial.
The green shows the GMROI%.
The red items are the traps, the GMROI is high, but there are few sales.
In Orange, you will see the stock on hand; this is a quick way of verifying that you have enough stock.
The amount it costs you now, the holding costs are displayed in blue.
Altogether, this is an informative report. You will find the summary at the end is loaded with some instrumental figures to examine. Also checkout Diet Coke - High GMROI and low stock holding.
The GMROI recipe is not a magic fix. What it is, is a straightforward computation that assists you with deciding on your stock.
Why are you waiting? Give it a try now?

