Point of Sale Software

Here are some Articles from the Blog Subject - Planning -

Now is the best time to start preparing a business plan?

POS SOFTWARE


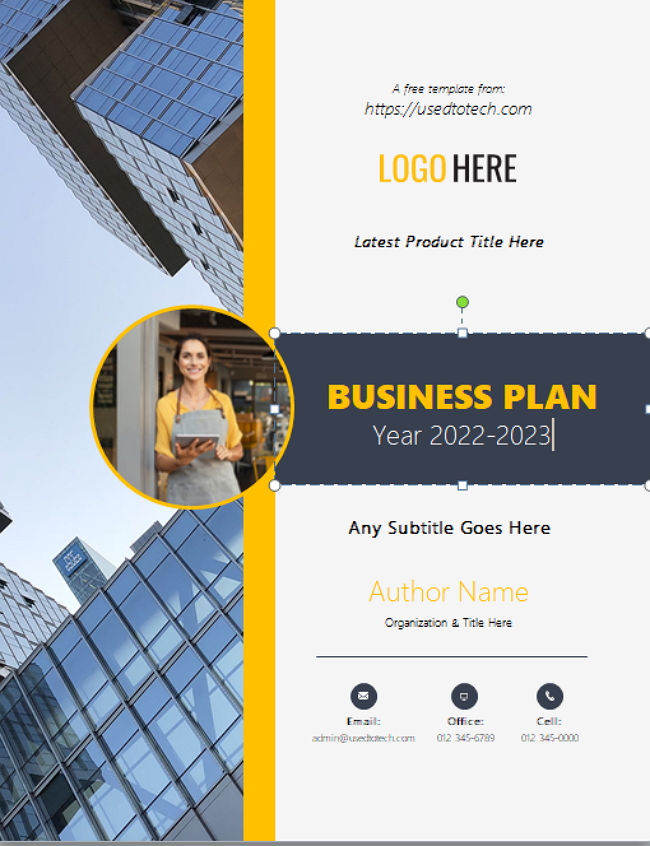
Creating a business plan for your shop

Making a well-crafted business plan can be rewarding and valuable. It provides clarity, direction, and a framework for moving forward.

Cost-Effective Planning Approaches

DIY vs Professional Business Plans

You can choose between crafting it yourself (DIY) or enlisting a professional. Both strategies offer distinct advantages and costs.

The DIY approach is cost-effective and typically free. It allows for intimate knowledge of your business and flexibility in timing and content. Many Australian banks offer free templates, which are familiar to the bank if you're seeking funding. A good one is available here, which is extensive and presentable.

Generally, it will take you about a week to work a few hours a day. It's one of those things that is easy on the third attempt, so count on mucking a few up in your first attempt. It should take a few hours a day over a few days. Remember, perfection isn't the goal; having something is better than having nothing.

If you prefer a professional business plan, writing typically costs around $6,000. You can expect a month-long timeline for completion. The process requires significant input from you to help writers understand your business model. While more expensive, this option provides high-level industry expertise. One plus is that it's perfect if you need a business plan for a bank or investors.

Draft the plan and present it to the professional for refinement to streamline the professional process and save time and money.

The closer the purpose aligns with securing funding, the more likely I find that the plan will be professionally designed and written.

Implementation and Monitoring

Your plan should include a section on budgeting for the upcoming year. Using your accountant's profit and loss statement is a good way to do this. I find the best approach is to take last year's figures, adjust them for the current year, and create a budget.

Once you've created your initial business plan, updating it in subsequent years becomes much more manageable. Typically, in my experience, only about 20% of the content changes annually, making it a manageable task.

The Power of Planning: Success Rates and ROI

“By failing to prepare, you are preparing to fail.” – Benjamin Franklin.

Don't overthink.

The goal is not perfection but a clear, actionable plan to guide your business towards success in the coming financial year and beyond.


Add new comment

Restricted HTML

  • Allowed HTML tags: <a href hreflang> <em> <strong> <cite> <blockquote cite> <code> <ul type> <ol start type> <li> <dl> <dt> <dd> <h2 id> <h3 id> <h4 id> <h5 id> <h6 id>
  • Lines and paragraphs break automatically.
  • Web page addresses and email addresses turn into links automatically.
CAPTCHA This question is for testing whether or not you are a human visitor and to prevent automated spam submissions. Image CAPTCHA
Enter the characters shown in the image.

How to Create a Useful Planogram of Your Shop

POS SOFTWARE

I've seen how helpful a good planogram can be for small stores. Since I've gotten questions about them, I want to share tips on making a planogram. This can:

  • Optimize your store layout
  • Boost sales

A planogram shows:

  • What shelves products go on
  • How to arrange products on shelves

The goal is to make shopping easy and encourage customers to buy more.

Why Planograms Matter for Retail Shops

Planograms are visual representations of your shop's layout, showing where products are placed and arranged. For most of us in retail, nothing beats a planogram to show visually what's happening in the shop.

A Cautionary Tale

Let me share a quick story. I had a client who had an ugly shop fit-out. When I talked to her about it, she told me that her partner was a carpenter who said, "I'll do it however you want." So she told him what she wanted, and he built it. Then she looked at the finished product and said, "This is what I asked for but not what I wanted." A planogram could have saved her a lot of disappointment.

Uses of Planograms

I've had clients whose sales have jumped by tweaking their store layout based on a well-crafted planogram.

The Great Debate on Professional Planogram Software

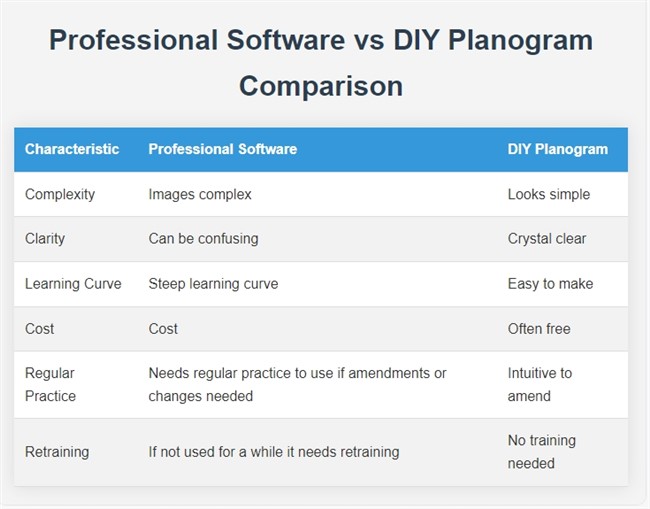
When I started discussing planograms, our competitors all suggested that people use professional packages. Now, you can use professional software, and its costs are pretty reasonable. However, they did not notice that these planograms look nice and are not straightforward to make or use.

Pros and Cons of Professional Software

Professional Software vs DIY Planogram Comparison

Professional planograms: you need to learn much before using them effectively. In my experience, if you're considering getting professional planogram software, I suggest purchasing one with a monthly subscription. These costs are relatively reasonable; you have lost little if the package fails.  Here is a decent discussion on this.

Most of us would be better off hiring someone who knows what they are doing rather than buying or renting such software.

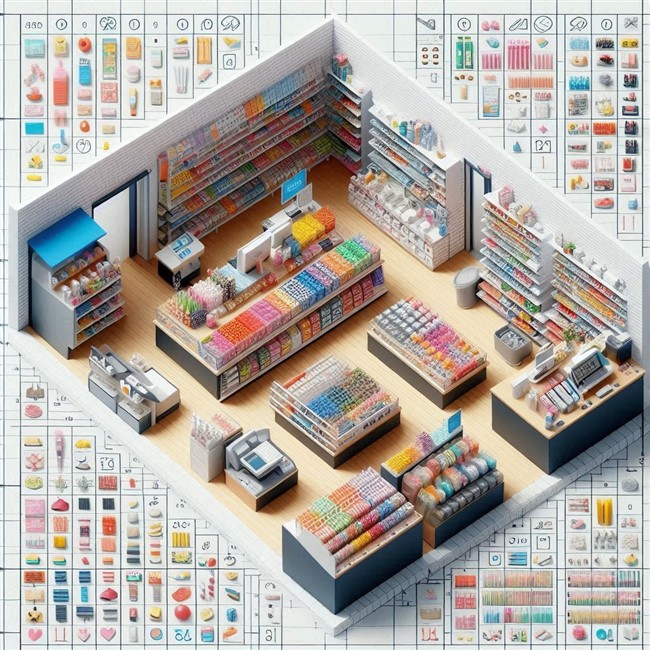
Here would be a typical result from a professional planogram.

planogram sample

Here is a manual one.

A diagram of your shop with your best sellers listed as

Blue = Good

Yellow = Moderate to bad

Red = Very bad

blank = Zero

It visually shows the shop's sales, but there is no denying that the professional one has a better look. However, I think the manual is clearer.

Step-by-Step Guide to Making a Planogram

Step 1: Gather Your Tools

You'll need:

  • A couple of large sheets of paper
  • Some grid paper
  • Pencil and eraser. A pencil's significant advantage is that, unlike a pen, it's easy to rub out mistakes.
  • Ruler
  • Triangle Right Angle ruler
  • Ruler with shapes (circles, triangles, squares) if possible
  • Tape measure or Laser Distance Meter

Pro tip: I prefer a Laser Distance Meter. They're relatively cheap now; one person can do all the measurements quickly.

Step 2: Measure Your Shop

  1. On grid paper, draw a rough outline of your shop.
  2. Measure the largest dimension of your shop.
  3. Write down this measurement on the grid paper.
  4. Start at the rear of the shop and go around, measuring the outer parts. Write down every measurement.
  5. Go from the rear left of the shop and measure important details from left to right.
  6. Work your way to the front.
  7. Double-check by measuring from front to back.

Step 3: Draw Your Layout

  1. Start with the rough sketch to get a grip on the situation.
  2. Check on the grid that the measurements make sense.
  3. Do not kid yourself if it's all correct; there is something you have done wrong.

Step 4: Draw Your Final Draft

  1. Grab the larger paper to draw your shop layout.
  2. Get the larger measurement (generally the shop length first)
  3. Use this measurement to make a scale on your paper. Use a decent scale (e.g., 1 cm = 1 metre, 2 cm = 1 metre).
  4. Draw the other measurements.

Pro tip: In my experience, even experts need a few attempts. If you're not doing it a lot, you may need more. That's perfectly normal!

Step 5: Use Your Planogram

Once you have a decent planogram, make many copies. Later, you'll use these for different objectives.

Conclusion

By taking the time to create a planogram, you're investing in your shop's future. Improving your layout, customer flow, and bottom line is a good step.

Happy planograming!

FAQ

Q: What is a planogram?
A: A planogram visually represents some of your shop's features.

Q: Why do Planograms Matter for retail shops?
A: Planograms help people visualize what is happening in the shop. They assist in optimizing space, improving customer flow, and maximizing sales.

Q: Do I need professional planogram software?
A: Not necessarily. 

Q: How do I start creating a planogram?
A: Starting with the most significant dimension, the shop's length.

Q: What's the best way to measure my shop?
A: A laser distance meter is recommended as it's quick, accurate, and can be operated by one person.

Q: How many attempts does it usually take to create one?
A: Even experts typically need three attempts: a rough sketch, a detailed version, and a final draft.

Q: What scale should I use when drawing one?
A: Something that is easy to calculate.

Q: Why should I make many copies?
A: Multiple copies allow you to use the planogram for different objectives and planning purposes.

Q: Can a planogram help prevent layout mistakes?
A: A planogram can help visualise the layout before implementation, potentially avoiding costly mistakes in shop fit-outs.


Add new comment

Restricted HTML

  • Allowed HTML tags: <a href hreflang> <em> <strong> <cite> <blockquote cite> <code> <ul type> <ol start type> <li> <dl> <dt> <dd> <h2 id> <h3 id> <h4 id> <h5 id> <h6 id>
  • Lines and paragraphs break automatically.
  • Web page addresses and email addresses turn into links automatically.
CAPTCHA This question is for testing whether or not you are a human visitor and to prevent automated spam submissions. Image CAPTCHA
Enter the characters shown in the image.

How to maximize Your shop's space

POS SOFTWARE

The better store space you have can drive sales and profits. A floor plan helps you look at your space from a new perspective. It lets you see how well your space works. We can study some key facts about your space. These facts show how well your space is used. Let's learn how to find these key facts, and then we can decide how to improve your space.

Why Space Performance KPIs Matter

You are paying for this space, so you must use it wisely. 

A floor plan helps you analyze your store's space and make wise choices. Let's explore how to calculate and understand these space indicators. This way, you can use data to grow your business.
You pay for your store space and want to use it well. Space indicators show how you use your shelves and areas. You see which spots work best by measuring sales or profit per shelf meter. This data lets you decide where to place products and manage stock. Better use of space leads to higher sales and happy customers.

Planograms

These are fundamental tools in retail today. They serve as detailed blueprints for arranging merchandise in a shop. They are visual representations that detail where and how retailers should place products on retail shelves or displays. 

There are a few critical elements to a planogram:

Shelf space allocation - Determining how much shelf space each product receives based on sales data to give high-demand products prominence.

Customer flow - Understanding how customers navigate and move through the store layout.  

Visual appeal - Creating attractive, balanced displays and colour schemes to improve the shopping environment.

Step-by-Step Guide to Calculating Space Performance

Follow these straightforward steps to calculate your space performance KPIs:

Measure Your Shelf Space:

Start by accurately measuring your store's linear metres of shelf space. I prefer using a tape measure, but pacing out the distance works.

Create a Detailed Store Layout:

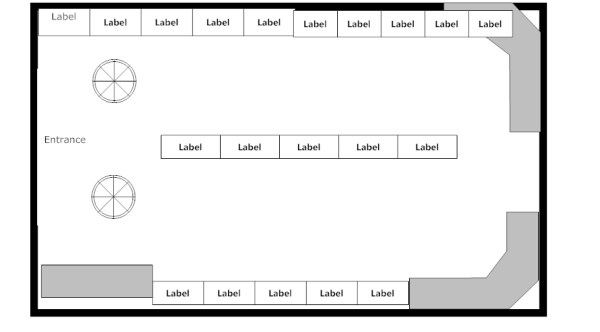
We call this a planogram, and a typical one looks like this:

Store plan

Create a precise drawing of your store using a large sheet of paper or cardboard. I find it helpful if it is lined. Include key areas like shelves, departments, and product sections. This visual guide will make it easier to examine your significant numbers later. In practice, I need to make a few attempts, so I do it once or twice with paper and only then use cardboard. I then recommend photocopying that sheet and working on the photocopy. Then, you can quickly make a new planogram when required, as it has many uses, which I have already discussed here.

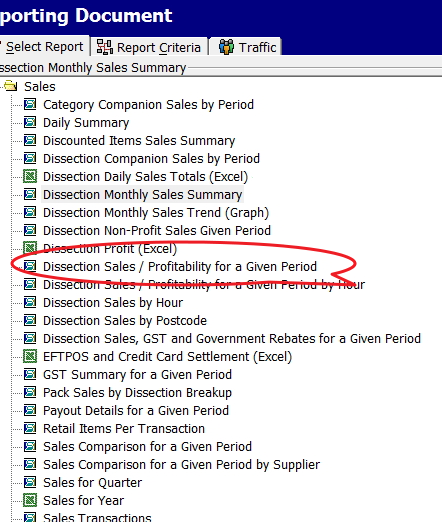
Gather Sales or Profit Data:

Now go to your point of sale system and get sales figures. Instead of using sales, I recommend using the number of sales and profit. So, I tend to use profit here because I think it's the most meaningful, but many prefer numbers. 

Sales breakdown report

Divide Sales/Profit by Linear Metres:

I prefer to use Excel for calculations, but many use calculators.

Divide the total numbers by the overall linear metres you have to give you an average. This will be your baseline.

Now divide the sales, number, or profit by the linear measurement. For example, if you had a $3,300 profit in that period and the shelf you paced is three steps, then your KPI = 1,100. Now go through each department and calculate the figures.

Categories Performance:

  • Blue: Very good
  • Green: Above average
  • Yellow: Average
  • Orange: Below average
  • Red: Poor

Now, we divide the results into five groups. I find it quicker to take the top items as they stand out and put them in my blue group, and then I dump the bad ones in the red. Now you are looking at the rest for every three yellows, a green and an orange. 

Visualise Results on Your Store Layout:

Use colour coding to mark the performance categories on your store layout drawing. This visual representation will help you quickly identify areas performing well and those needing attention.

Interpreting and Acting on Your Space Performance KPIs

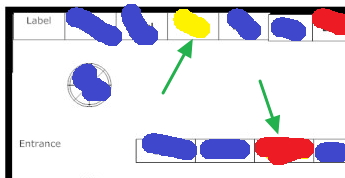
See where the green arrow points. Apparently, there is something to investigate at these spots. See the green arrow pointing to red. This is a problem. Everything around is blue, so it is not the location. As this simple example shows, this KPI is a good indicator of how effective your use of space has been. You can use this to make stock, marketing, and layout decisions.

Although I have used profit here, try the same thing with numbers. What you want with numbers is to see that your clients are attracted to going deep into the shop.

  1. Identify Underperforming Areas: Look for sections marked in orange or red on your store layout. These areas may require changes in product placement, merchandising strategies, or promotional efforts to boost performance. Often, the suggestion here is to reduce the spot size.

  2. Analyse High-Performing Areas: Examine the blue and green sections to understand what is driving their success. Consider increasing the spot for the points marked in blue.

  3. Monitor Customer Flow: Pay close attention to areas where customers seem to be drawn in deeper or where they tend to linger. This technique can assist you in enhancing product arrangement and layout to encourage more browsing and impulsive buying.

  4. Adjust Stock Levels: Use this KPI information to adjust stock levels for various products or categories, ensuring you have the appropriate inventory in suitable locations. Increase the spot size for high-performing items and decrease it for underperforming items.

  5. Implement Strategic Promotions: Use your KPI data to check the underperforming areas. Alternatively, you may consider replacing underperforming items with other stock that sells better in those areas.

  6. Regularly Review and Adjust: Measuring and analyzing space performance KPIs should be ongoing. Review it regularly to maintain an optimized and profitable store layout.

Continuous Improvement and Customer Satisfaction

As discussed, measuring and analysing space performance KPIs is a continuous process. Regularly reviewing and adjusting your store layout and product placement based on your data ensures that your store is continually optimised for maximum sales and customer satisfaction.

The reality is that facts should have the final say, not your gut feeling.

Start now to maximize your store's potential. It takes about half an hour, and you will have much to consider. So start measuring your space performance KPIs today.

Add new comment

Restricted HTML

  • Allowed HTML tags: <a href hreflang> <em> <strong> <cite> <blockquote cite> <code> <ul type> <ol start type> <li> <dl> <dt> <dd> <h2 id> <h3 id> <h4 id> <h5 id> <h6 id>
  • Lines and paragraphs break automatically.
  • Web page addresses and email addresses turn into links automatically.
CAPTCHA This question is for testing whether or not you are a human visitor and to prevent automated spam submissions. Image CAPTCHA
Enter the characters shown in the image.

Mind Mapping for Retailers in their shops

POS SOFTWARE

The Power of Mind Mapping for Small Business Retailers

As a small business owner, you likely juggle countless ideas, tasks, goals, and data points on a daily basis. Keeping it all organized in your head can quickly become overwhelming. This is where mind mapping comes in handy!

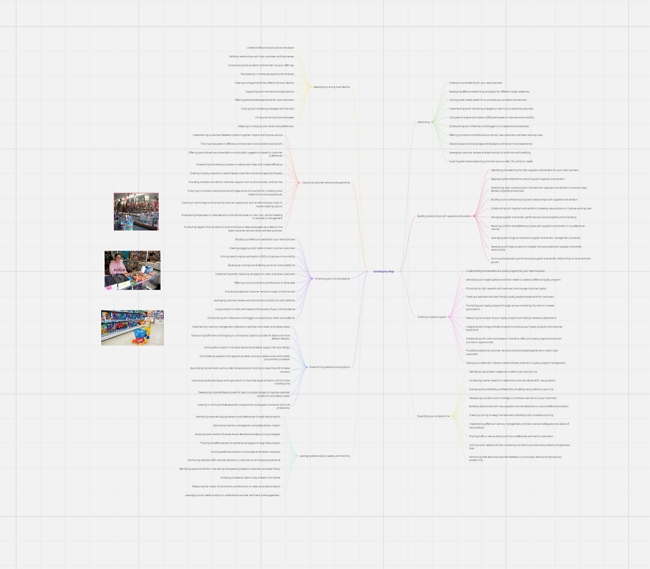
Many are now taught mind mapping in school. In my experience, most people do not like them often, claiming it gives them headaches, but some use it a lot. Some like me only occasionally when the thinking gets tough. This mind map took me about twenty minutes to write but I am a perfectionist.

What is Mind Mapping?

A mind map is a visual diagram of your thoughts on a subject. Most use lines, colours, images and keywords to represent their ideas. Where there are a lot of ideas, keeping it all straight in your head can be a challenge! This is where mind mapping comes in handy. It can help provide a way to visually organise your thoughts on strategies, systems, products, and more. You start with an idea and think of other ideas that come from this idea. Its great for brain storming with others.

We looked at many mind mapping software, then selected AXON 2001, which was a brilliant piece of software. Then we organised a group buy of mind mapping software, AXON 2001. Unfortunately, it is no longer on the market. Although it's still very good, the problem is that it's been over 20 years, and as we cannot get more copies for our clients, plus it is old, we looked at an alternative for our clients who want to do mind mapping.

The one we are suggesting now is Miro. It has an excellent free program, it has functions that paid versions do not have. If you do not like it, well at least you will know better what you need. 

Here is a brief explanation of the product

Mind Mapping in Action

Let's look at some ways a retailer would use mind mapping:

  • Planning a promotion: Map out objectives, tasks, timeline, budget, marketing tactics

  • Developing new products lines: Brainstorm possibilities, identify customer needs, map manufacturing process

  • Optimising inventory: Analyze sales data, plan ideal stock levels of top-selling items

  • Improving customer service: Identify pain points, explore solutions, implement training

  • Streamlining operations: Examine workflow, identify bottlenecks and inefficiencies, implement changes

Start Mapping Today!

You don't need any fancy software to start mind mapping, a pen and paper can do it often better.  Nowdays most use software as its faster and cleaner.

Some tips that work for me:

  • Write the topic in the centre

  • Put in some pictures to help you think, I find colour pictures work better. (See the mindmaps above has pictures of a shop)

  • Use lots of colours, I find putting related topics with the same colour helps a lot. 

  • Use the AI, it saves heaps of time

  • If it starts going too big, over 40 items, split it up into two mindmaps. 

If we get enough interest in the product, we will be adding hooks into it too.


Add new comment

Restricted HTML

  • Allowed HTML tags: <a href hreflang> <em> <strong> <cite> <blockquote cite> <code> <ul type> <ol start type> <li> <dl> <dt> <dd> <h2 id> <h3 id> <h4 id> <h5 id> <h6 id>
  • Lines and paragraphs break automatically.
  • Web page addresses and email addresses turn into links automatically.
CAPTCHA This question is for testing whether or not you are a human visitor and to prevent automated spam submissions. Image CAPTCHA
Enter the characters shown in the image.

Plan Your Business for the Next Financial Year

POS SOFTWARE

Business person planning

We have now ended the fiscal year. This is the best time to take a moment to evaluate your business to make plans for the future, as you now have the most accurate information regarding your company's financial standing, inventory levels, profitability, and other metrics. Using this to make well-informed choices about your business direction.

Initial aspects to consider when planning for the next financial year: 

>Employees: This is crucial in driving your business forward.

>Customers: Look at your client's preferences and what they want in your business.

>Competitive landscape: Look at industry trends, particularly your competition's strategies.  Go into your competition shop, look around and ask yourself why are they doing this?

>Technology: Ensure your technologies will do the job. Technology is constantly changing.

Now make a budget for next year.

Not hard, generally.

We estimate future figures by comparing current financials against those from the previous year, plus adding some experience. Your accountant should be able to provide a Profit and Loss statement outlining income and expenses for this year and last year; even better if they can do it with five years. To predict future earnings, look at the previous history for each item and now make an educated guess of the changes, e.g. add 5% to the current figure or subtract 2%.

You now have a budget to check out. 

Have a chew

So how is your business travelling? 

Do you have enough cash flow to cover your expenses? 

Are you profitable?

Conclusion

Now you have these factors. Develop your path to set your business up for success in the coming year.

Happy planning!

Add new comment

Restricted HTML

  • Allowed HTML tags: <a href hreflang> <em> <strong> <cite> <blockquote cite> <code> <ul type> <ol start type> <li> <dl> <dt> <dd> <h2 id> <h3 id> <h4 id> <h5 id> <h6 id>
  • Lines and paragraphs break automatically.
  • Web page addresses and email addresses turn into links automatically.
CAPTCHA This question is for testing whether or not you are a human visitor and to prevent automated spam submissions. Image CAPTCHA
Enter the characters shown in the image.

Now start to make Your Business Goals

POS SOFTWARE

The Only Way Is Forward

Today is the start of the new financial year. The business clock begins again. Now you will have figures for last year, making it the ideal opportunity to set your business objectives for this year as you can use the figures you have from the previous year.

Here are a few focuses, I recommend that you do

1) Reflect on how your year 2021/22 has gone - write a few points down. Measure the performance of your business with our accurate and efficient data reports. See what has worked out and what has not worked out.

2) Make a preliminary financial budget for the following year. Make it sensible and reachable as if it isn't; in my experience, it is futile.

3) Do a SWOT examination on your business? It takes five minutes to learn. I find it better to do it once and then come back a few days later to complete it. My mind seems to work on it, even though I do not think about it. You can examine what your Strengths, Weaknesses, your Opportunities and your Threats are. If there is enough interest, I am happy to do a webinar on how this works in retail.


4) Combining your preliminary financial budget and SWOT can help you set reasonable targets for this year. Write them down.

The more you plan, the better.

Add new comment

Restricted HTML

  • Allowed HTML tags: <a href hreflang> <em> <strong> <cite> <blockquote cite> <code> <ul type> <ol start type> <li> <dl> <dt> <dd> <h2 id> <h3 id> <h4 id> <h5 id> <h6 id>
  • Lines and paragraphs break automatically.
  • Web page addresses and email addresses turn into links automatically.
CAPTCHA This question is for testing whether or not you are a human visitor and to prevent automated spam submissions. Image CAPTCHA
Enter the characters shown in the image.

Financial Planning Fees and what you can do about it.

POS SOFTWARE

Many of my clients use financial advisors every year. So we have worked with a few financial planners on behalf of our clients. So the information they need is in your POS system for your shop.

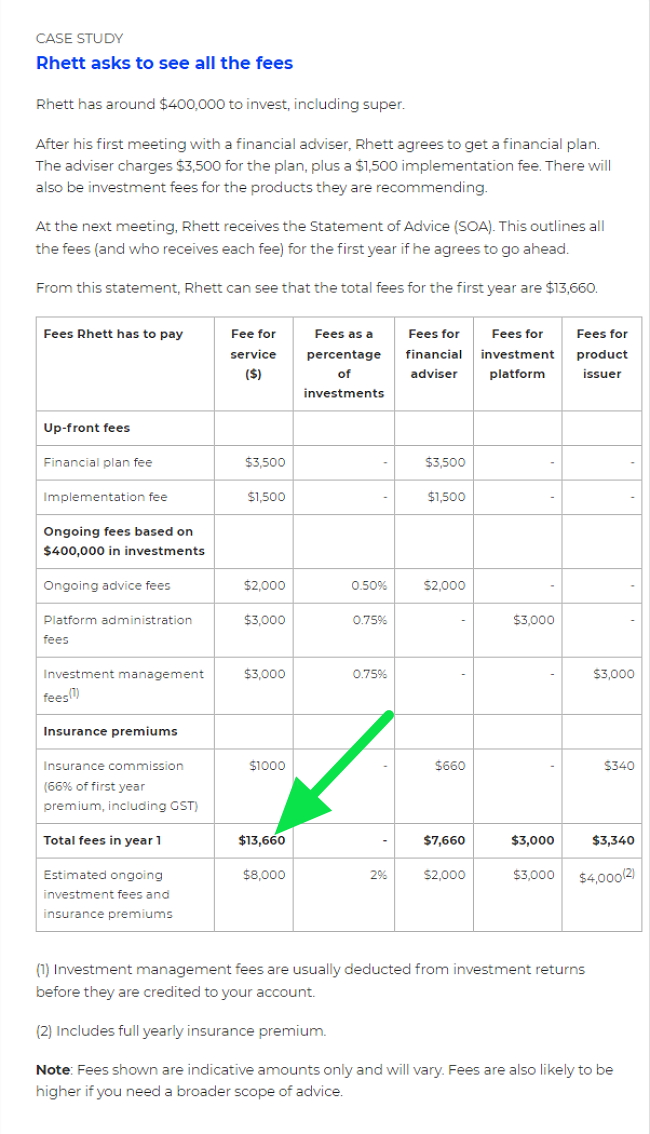
Generally, the cost is between $1,500 and $3,500 a year; yet it can be more. For example, here. Look at the case study below and see the green arrow pointing to the first year fee.


​That is $13,660 initially and an ongoing fee per year of $8,000. That is a lot of money on a personal $400,000 investment fund.

There are several reasons why the cost is so high. Part of the reason is that it takes almost as much effort to do a plan of $400,000 as it takes to do one of $4,000,000. The items, decisions and complexity are similar, and all that changes is the amounts. This is a typical problem in accounting.

But the other reason is the time taken by the financial planner to put together the plan. You go to them and say you need this. They then request a heap of information. You then hunt for the information, put it together, and they then examine this information. They interrogate you for clarification, then, as sure as day follows night, they ask for more information, so you have to hunt around for some more documentation, supply it, and only then can they start. Most of the time is spent collecting the information, not doing the actual work.

The result is that you pay much more than you should.

I will give you a personal example of how the price can spiral. I paid $1,500 for a financial plan, which I did not want, but I had to get one for taxation reasons. Then, after paying that, I received another bill of $500 to pay the accountant fees used in the plan. Then, after paying the accountant fees, I found that there were two entities involved, so the other had to be done too. Then it was announced that this was a yearly fee. So a one-time fee went from $1,500 to $4,000 yearly, which was stated as a very cheap fee. I felt that there had to be a better way.

I knew that I could save a lot by being organised and doing much of the job myself.

So I looked at a few online tools. I generally found them of limited use, more for amusement than helpful.

Then I found one I liked "projection lab."

It a professional online tool. You enter in the information. Since its only me, only I have access to the information. Then I could then experiment with it and so model my financial future. I know what I put in will not precisely match real life. But it's better than a vague concept in my head. Plus I can ask it questions and decide what I like about the consequences.

It had enough functions for me but I suppose as I learn more, I will use more. for now its fine.

Best of all, my accountant told me that it should be acceptable for the ATO for my purposes. Of course, if I had to go to a financial planner, I would be better organised as most of the information would be on hand for them.

It is free, so give it a go. At least if it does not work for you, you will have a better idea of what you need.

Let me know how it goes for you.

Add new comment

Restricted HTML

  • Allowed HTML tags: <a href hreflang> <em> <strong> <cite> <blockquote cite> <code> <ul type> <ol start type> <li> <dl> <dt> <dd> <h2 id> <h3 id> <h4 id> <h5 id> <h6 id>
  • Lines and paragraphs break automatically.
  • Web page addresses and email addresses turn into links automatically.
CAPTCHA This question is for testing whether or not you are a human visitor and to prevent automated spam submissions. Image CAPTCHA
Enter the characters shown in the image.

Australia is preparing to re-open

POS SOFTWARE


Since the lockdown, suddenly like everyone else our business came to a halt but now it is starting to move. People are preparing for the reopening and orders are coming in. Even with the lockdown, computers are getting old, equipment needs to be replaced, new shops are being planned, and life goes on. As the world is starting to re-open, so is Australia too. We are now easing restrictions. The big problem here is that unlike many countries in the Northern Hemisphere we are going into winter, which is our flu period so that we will be a bit later. 

We are in the middle of the worst pandemic in 100 years and we are getting through it. We have got through it much better then our grandparents did with Spanish flu and now is the time to start making plans for the re-opening. This is what people are doing now. Changes will have to be done but we move forward.

“Life has to go on even when you don't want it to or when you feel unable to participate. The world doesn't stop turning for anyone.”Stewart Stafford


Add new comment

Restricted HTML

  • Allowed HTML tags: <a href hreflang> <em> <strong> <cite> <blockquote cite> <code> <ul type> <ol start type> <li> <dl> <dt> <dd> <h2 id> <h3 id> <h4 id> <h5 id> <h6 id>
  • Lines and paragraphs break automatically.
  • Web page addresses and email addresses turn into links automatically.
CAPTCHA This question is for testing whether or not you are a human visitor and to prevent automated spam submissions. Image CAPTCHA
Enter the characters shown in the image.