The better store space you have can drive sales and profits. A floor plan helps you look at your space from a new perspective. It lets you see how well your space works. We can study some key facts about your space. These facts show how well your space is used. Let's learn how to find these key facts, and then we can decide how to improve your space.
Why Space Performance KPIs Matter
You are paying for this space, so you must use it wisely.
A floor plan helps you analyze your store's space and make wise choices. Let's explore how to calculate and understand these space indicators. This way, you can use data to grow your business.
You pay for your store space and want to use it well. Space indicators show how you use your shelves and areas. You see which spots work best by measuring sales or profit per shelf meter. This data lets you decide where to place products and manage stock. Better use of space leads to higher sales and happy customers.
Planograms
These are fundamental tools in retail today. They serve as detailed blueprints for arranging merchandise in a shop. They are visual representations that detail where and how retailers should place products on retail shelves or displays.
There are a few critical elements to a planogram:
Shelf space allocation - Determining how much shelf space each product receives based on sales data to give high-demand products prominence.
Customer flow - Understanding how customers navigate and move through the store layout.
Visual appeal - Creating attractive, balanced displays and colour schemes to improve the shopping environment.
Step-by-Step Guide to Calculating Space Performance
Follow these straightforward steps to calculate your space performance KPIs:
Measure Your Shelf Space:
Start by accurately measuring your store's linear metres of shelf space. I prefer using a tape measure, but pacing out the distance works.
Create a Detailed Store Layout:
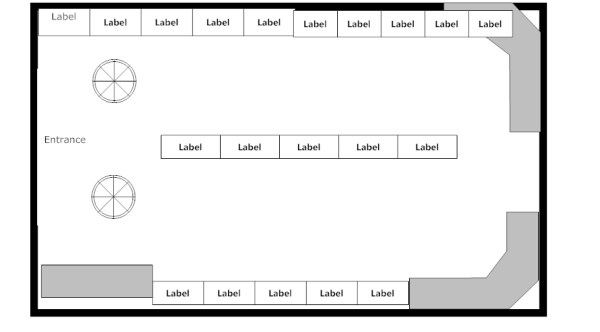
We call this a planogram, and a typical one looks like this:

Create a precise drawing of your store using a large sheet of paper or cardboard. I find it helpful if it is lined. Include key areas like shelves, departments, and product sections. This visual guide will make it easier to examine your significant numbers later. In practice, I need to make a few attempts, so I do it once or twice with paper and only then use cardboard. I then recommend photocopying that sheet and working on the photocopy. Then, you can quickly make a new planogram when required, as it has many uses, which I have already discussed here.
Gather Sales or Profit Data:
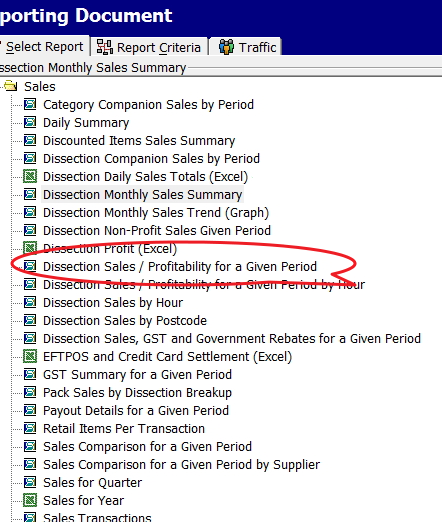
Now go to your point of sale system and get sales figures. Instead of using sales, I recommend using the number of sales and profit. So, I tend to use profit here because I think it's the most meaningful, but many prefer numbers.

Divide Sales/Profit by Linear Metres:
I prefer to use Excel for calculations, but many use calculators.
Divide the total numbers by the overall linear metres you have to give you an average. This will be your baseline.
Now divide the sales, number, or profit by the linear measurement. For example, if you had a $3,300 profit in that period and the shelf you paced is three steps, then your KPI = 1,100. Now go through each department and calculate the figures.
Categories Performance:
- Blue: Very good
- Green: Above average
- Yellow: Average
- Orange: Below average
- Red: Poor
Now, we divide the results into five groups. I find it quicker to take the top items as they stand out and put them in my blue group, and then I dump the bad ones in the red. Now you are looking at the rest for every three yellows, a green and an orange.
Visualise Results on Your Store Layout:
Use colour coding to mark the performance categories on your store layout drawing. This visual representation will help you quickly identify areas performing well and those needing attention.
Interpreting and Acting on Your Space Performance KPIs

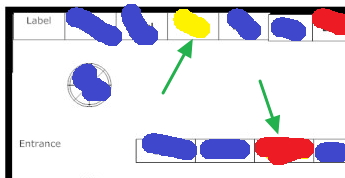
See where the green arrow points. Apparently, there is something to investigate at these spots. See the green arrow pointing to red. This is a problem. Everything around is blue, so it is not the location. As this simple example shows, this KPI is a good indicator of how effective your use of space has been. You can use this to make stock, marketing, and layout decisions.
Although I have used profit here, try the same thing with numbers. What you want with numbers is to see that your clients are attracted to going deep into the shop.
-
Identify Underperforming Areas: Look for sections marked in orange or red on your store layout. These areas may require changes in product placement, merchandising strategies, or promotional efforts to boost performance. Often, the suggestion here is to reduce the spot size.
-
Analyse High-Performing Areas: Examine the blue and green sections to understand what is driving their success. Consider increasing the spot for the points marked in blue.
-
Monitor Customer Flow: Pay close attention to areas where customers seem to be drawn in deeper or where they tend to linger. This technique can assist you in enhancing product arrangement and layout to encourage more browsing and impulsive buying.
-
Adjust Stock Levels: Use this KPI information to adjust stock levels for various products or categories, ensuring you have the appropriate inventory in suitable locations. Increase the spot size for high-performing items and decrease it for underperforming items.
-
Implement Strategic Promotions: Use your KPI data to check the underperforming areas. Alternatively, you may consider replacing underperforming items with other stock that sells better in those areas.
-
Regularly Review and Adjust: Measuring and analyzing space performance KPIs should be ongoing. Review it regularly to maintain an optimized and profitable store layout.
Continuous Improvement and Customer Satisfaction
As discussed, measuring and analysing space performance KPIs is a continuous process. Regularly reviewing and adjusting your store layout and product placement based on your data ensures that your store is continually optimised for maximum sales and customer satisfaction.
The reality is that facts should have the final say, not your gut feeling.
Start now to maximize your store's potential. It takes about half an hour, and you will have much to consider. So start measuring your space performance KPIs today.


