Point of Sale Software

Here are some Articles from the Blog Subject - Retail inventory -

Boost Retail Profits with Smart Fulfillment (2024)

POS SOFTWARE

partial fulfilment

If you are struggling with order fulfilment, look at partial fulfilment.

Understanding Partial Fulfillment

Partial fulfilment is a strategy in which the retailer has backorders from customers; they then ship the available items and bill from an order ASAP while leaving the rest on backorder. This approach offers flexibility in order processing, improving customer satisfaction and cash flow.

How Partial Fulfillment Works

The process is straightforward:

  1. A customer places an order for multiple items.
  2. Your inventory system identifies which items are in stock.
  3. When available, the items are shipped immediately.
  4. Out-of-stock items remain on backorder to be shipped when available.

So, customers receive a portion of their order now rather than waiting for all items to be in stock before shipping.

The Advantages of Partial Fulfillment

Implementing partial fulfilment brings numerous benefits to your retail business:

Improved Cash Flow

By shipping available items immediately, you can invoice and receive payment sooner.

Enhanced Customer Satisfaction

Customers appreciate receiving part of their order quickly rather than waiting for everything to be in stock.

Reduced Storage Costs

You can operate with leaner inventory levels, reducing warehouse space requirements.

Better Inventory Management

It is easier to keep track of items more effectively.

Multi-Location Stock Management

You can often order directly from the supplier and deliver the goods directly to the customer. Just be careful that the customer needs to get the price. I find this cheaper and more manageable. If they provide it to me anyway, and then I deliver it to the customer, why not have the supplier do it directly? Let them have the headache and cost of delivery.

Increased Flexibility

You can fulfil orders from whichever location has the stock available.

Faster Order Processing

By utilising stock from multiple locations, you can process orders more quickly.

Reduced Shipping Costs

Often, you can ship from the location closest to the customer, minimising shipping expenses.

Implementing Partial fullfilment

Go to business invoicing.

This is a test example of how it works

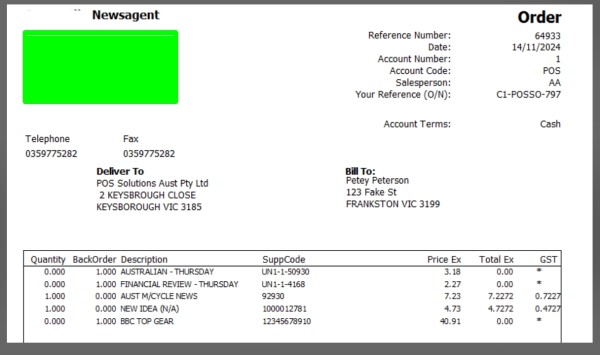
Orginal customer back-order


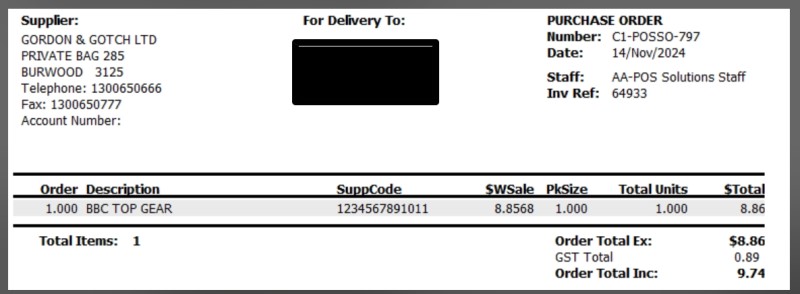
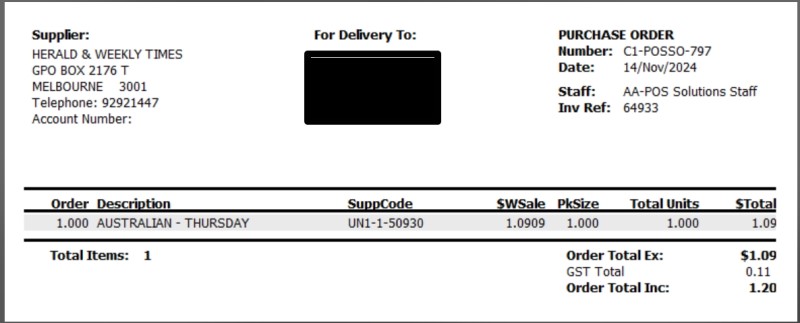
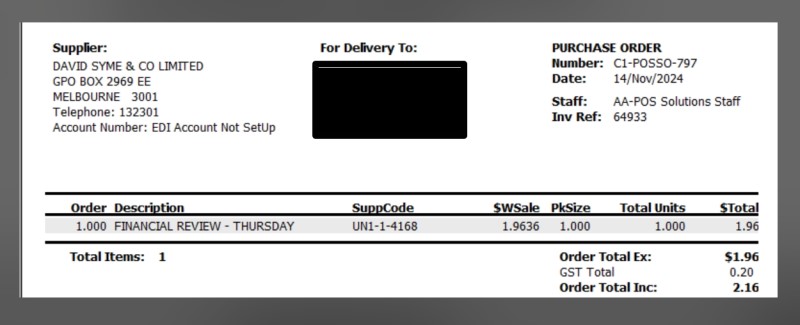
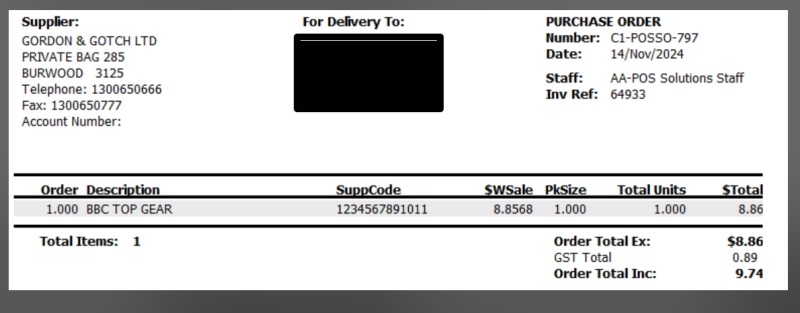
Now, we have four separate orders from suppliers to fulfil the customer's order

Second supplier for back-order fulfilment

First supplier for back-order fulfilment

Forth supplier for back-order fulfilment

Third supplier for back-order fulfilment

Why wait till the last one of these arrived to ship it out?

Train Your Staff

Properly educate your team on handling partial orders.

Overcoming Common Challenges

While implementing these strategies, you may encounter some challenges:

Clear Customer Communication

Be transparent about partial shipments and expected delivery dates for back-ordered items. I would like to include the shipping details so the customer can directly contact the shipper without me having to deal with the middleman's headaches.

Managing Shipping Logistics

You may need to coordinate with multiple carriers or locations. With our POS System and correct processes in place, these challenges can be effectively managed.

Success Stories: Australian Retail Triumphs

Consider these real-world examples of Australian retailers who have successfully implemented these strategies:

  1. Newsagents doing Back to School Often wait for goods to arrive on the order, but why hold up 90% of the order because 10% has yet to come?
  2. We do it - We often have to wait for a part, but there is no reason we cannot send out what we have now.

    Conclusion

    Learning how to do partial fulfilment can transform your retail business. It enables you to maximise inventory, improve customer satisfaction, and boost revenue.


FAQ

Q: What does it mean when an item is back-ordered? 
A: A back-ordered item is generally out of stock in the shop, but the supplier can still purchase it with a future delivery date once inventory is replenished. The item will be shipped when it becomes available again, and customers are placing orders for when it arrives.

Q: What is the difference between backorder and out-of-stock?
A: The key differences are:
- Backorders can still be purchased and will be delivered when available
- Out-of-stock items cannot be ordered until they return to inventory
- Backorders have an estimated delivery timeframe
- Out-of-stock items have no guaranteed return date

Q: What is the difference between a backorder and a pre-order?
A: Here are the main distinctions:
- Pre-orders are placed before an item is released or manufactured
- Backorders are placed after an item has been released but is temporarily unavailable
- Pre-orders typically require upfront payment
- Backorders usually charge payment upon shipping
- Pre-orders help gauge initial demand
- Backorders help manage existing demand for established products

Q: How does the partial fulfilment process work? 
A: 1. Customer submits an order for multiple items
2. System checks inventory availability
3. Available items are shipped immediately
4. Backordered items are shipped when they become available

Q: Can suppliers ship directly to customers?
A: Suppliers often can ship directly to customers, reducing handling costs and delivery complications.

Q: What do I need to prepare before implementing partial fulfilment?
A: - Train staff on handling partial orders
- Set up proper business invoicing systems
- Establish clear communication protocols
- Implement inventory tracking systems

Q: How do I manage shipping logistics?
A: Coordinate with multiple carriers and locations through your POS System and established processes.

Q: How should I communicate partial shipments to customers?
A: Provide transparent information about:
- Which items are shipping immediately
- Expected delivery dates for back-ordered items
- Shipping tracking details

Q: Will customers accept partial deliveries?
A: Generally, customers prefer receiving some available items quickly rather than waiting for complete orders.

Q: What are the financial benefits?
A: - Improved cash flow from faster billing
- Reduced storage costs
- Lower shipping expenses through optimized delivery routes
- Better inventory turnover

Q: How does it affect inventory management?
A: - Enables leaner inventory levels
- Improves stock tracking
- Allows for multi-location stock management
- Facilitates faster order processing

Add new comment

Restricted HTML

  • Allowed HTML tags: <a href hreflang> <em> <strong> <cite> <blockquote cite> <code> <ul type> <ol start type> <li> <dl> <dt> <dd> <h2 id> <h3 id> <h4 id> <h5 id> <h6 id>
  • Lines and paragraphs break automatically.
  • Web page addresses and email addresses turn into links automatically.
CAPTCHA This question is for testing whether or not you are a human visitor and to prevent automated spam submissions. Image CAPTCHA
Enter the characters shown in the image.

Stock that is not performing

POS SOFTWARE

Today, we follow up on yesterday's blog post, in which I discussed your best sellers. I suggest you read it.


In many shops I go into, I see old stock that did not budge. It is a common problem that can seriously impact your bottom line. Let's explore how you can deal with this slow-moving stock. It would free up valuable space for your best performers.

Why Tackle Slow-Moving Stock?

Before we get into the nitty-gritty, let's discuss why this matters. Slow-moving stock is like a guest who's overstayed their welcome - they're taking up space, costing you money, and contributing little in return. By addressing this issue, you can:

  • Free up valuable shelf space
  • Improve cash flow
  • Reduce storage costs
  • Make room for more profitable items

Identifying the Culprits

Step 1: Run a Slow-Moving Stock Report

First things first, let's find out what's not selling. Here's how:

  1. Open your POS system
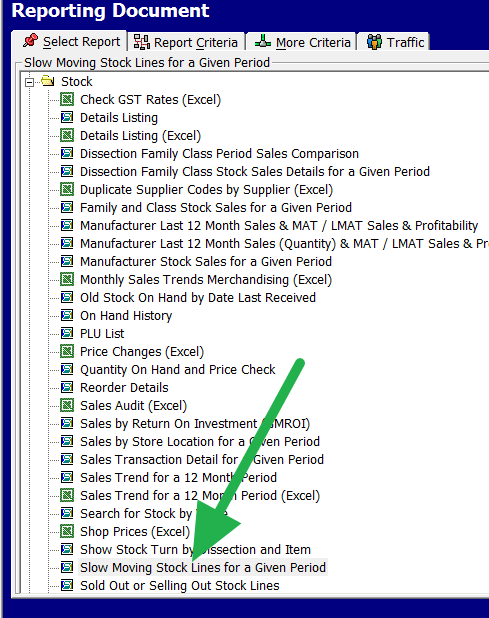
  2. Navigate to Register reports > Stock > Slow moving Stock lines
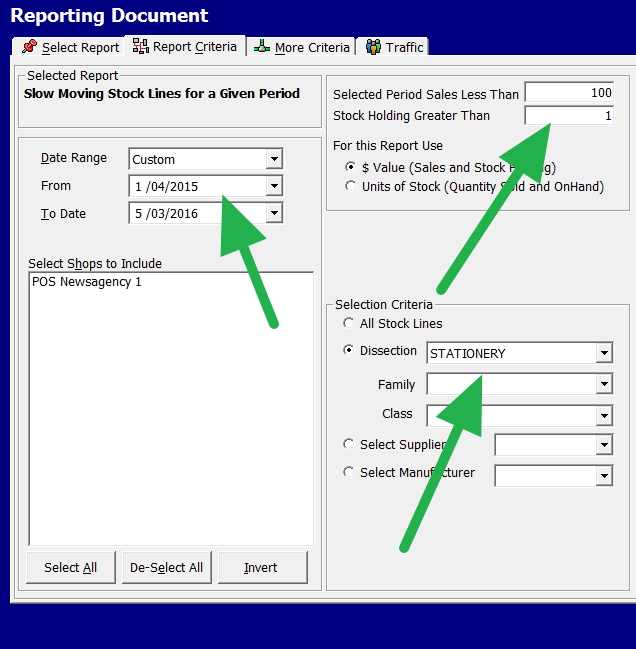
  3. Set your parameters (e.g., stationery department, last 12 months, sales under $100)

When I did this recently for a client, we uncovered a whopping $80,000 worth of slow-moving stock. That's a lot of capital tied up in items that aren't pulling their weight!

Now call it up here


As you can see, I have been looking at the stationery department for over twelve months for anything I have sold for less than $100 and am now stocking.
Now, out pops a report, in this case, 81 pages of detailed information on all the items that match this condition; we have almost $80,000 worth of worthless stock.


Check them out, remove what you do not want to keep, and put it in your sales area.


Once you've got this done


Report your top-selling stock items and look at those selling well. A rule of thumb in retail is that doubling the space of an item increases its sales by 50%. The idea here is to replace the marginal items with those that sell well.


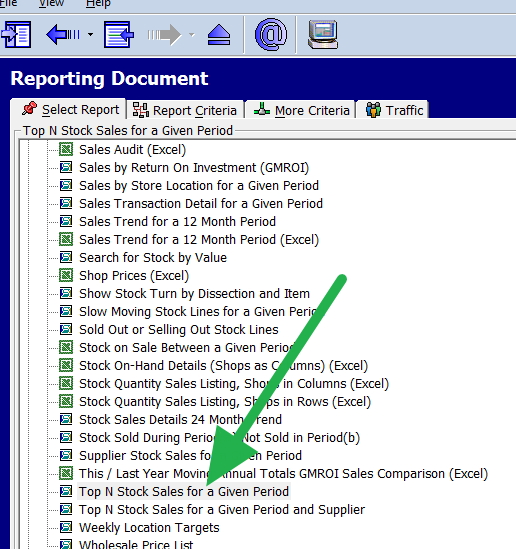
Go to Register reports.

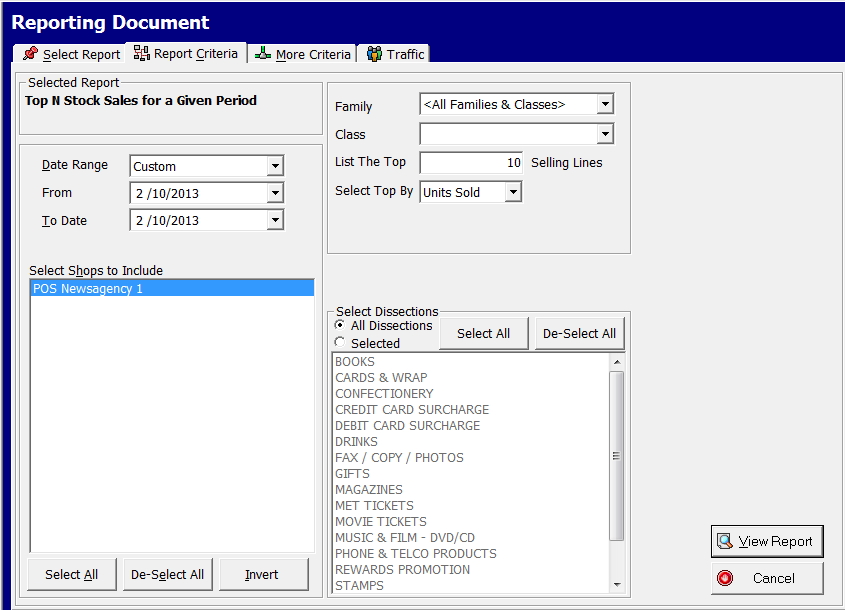
Now select "Top N Stock Sales for a Given Period."

Now, the following comes up.


Now, put an appropriate period. The default here of a day is not enough 

Note: I just wanted a quick report for illustration.

Step 2: Analyse the Results

Once you've got your report, it's time to roll up your sleeves and dig in. Go through each item and ask yourself:

  • Is this still relevant to my business?
  • Is there a reason it's not selling (poor placement, pricing issues)?
  • Can it be bundled with faster-moving items?

Making Room for the Stars

Now that you've identified your slow movers, it's time to give your top performers the spotlight they deserve.

Step 1: Identify Your Best Sellers

  1. Go back to your POS system
  2. Navigate to Register reports
  3. Select "Top N Stock Sales for a Given Period"
  4. Choose a meaningful timeframe (I recommend at least a month)

Step 2: Optimise Your Layout

Here's a little retail secret I've learned over the years: doubling the space for a product can increase its sales by up to 50%. With this in mind, consider:

  • Giving more prominent placement to your top sellers
  • Reducing space for slower-moving items
  • Ensuring your layout guides customers towards your best performers

Putting It All Together

Remember, your store space is valuable real estate. Every square metre should be working hard for you. Regularly reviewing your stock performance and adjusting your layout accordingly can significantly boost your profitability.

This process isn't a one-and-done deal. Make it a habit to run these reports and review your layout quarterly. Your stock mix and customer preferences will change, and your store should evolve.

The Bottom Line

Don't let slow-moving stock weigh you down. By identifying these items and making space for your stars, you're not just clearing shelves but setting your business up for success. So, fire up that POS system, run those reports, and start optimising. Your future self (and your bank account) will thank you!


Add new comment

Restricted HTML

  • Allowed HTML tags: <a href hreflang> <em> <strong> <cite> <blockquote cite> <code> <ul type> <ol start type> <li> <dl> <dt> <dd> <h2 id> <h3 id> <h4 id> <h5 id> <h6 id>
  • Lines and paragraphs break automatically.
  • Web page addresses and email addresses turn into links automatically.
CAPTCHA This question is for testing whether or not you are a human visitor and to prevent automated spam submissions. Image CAPTCHA
Enter the characters shown in the image.

More on Economic Ordering Quantity (EOQ)

POS SOFTWARE

Economic Ordering Quantity (EOQ)
Since my last post on Economic Ordering Quantity (EOQ) here, I've got a few questions. Many wanted more details on how to do the calculations for their shop. Since there is interest, I made a comprehensive reply here to explain it fully; that way, I can answer in mass.

Please remember that this requires information from your POS System, some technical skills and access to either Excel or OpenOffice (which are free, by the way).

Why EOQ Matters

Before we dive into the nitty-gritty, let's discuss why EOQ is special. It's a scientific way to manage your business to help you achieve maximum profitability by looking at the real world, where the stock cost goes beyond just the price of an item by the supplier. It addresses how often you should order stock from a supplier (Stock optimisation).

Now, if you buy too much, and it sits on your shelves:

- It then takes up valuable space

- Suffers from shoplifters

- Tying up your overdraft.

etc

Conversely, on the flip side:

- Not buying enough can cost you sales.

EOQ is designed to find the sweet spot between these two problems.

The EOQ Formula

Here's the formula used that mathematicians looking at the problem found:

Number of times to order = SQR(2 x D x k / h)

Where:

  • D is the ordering quantity of the item
  • k is the cost of ordering
  • h is the holding costs

I know our system isn't designed to handle this calculation directly, and the reasons will become clear why not here, but we've got a nifty ad-hoc reporting system that can do it, and it's a great way if you work through this of the power of our Ad-hoc reporting. Trust me, it's worth learning how to use it the Ad-hoc reporting. I think you'll be amazed at the power you have in your Point of Sale Software now.

How to get your EOQ

I never said it would be easy, only that it's a worthwhile exercise.

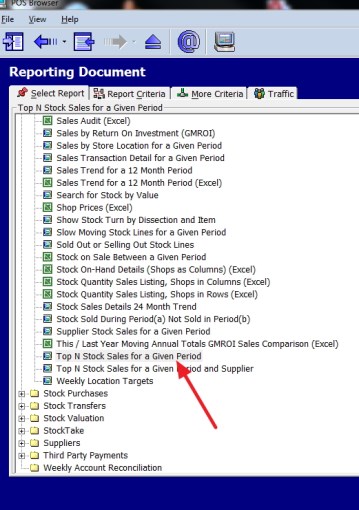
Go to register reports and select the top stock report, which is marked with the red arrow here.

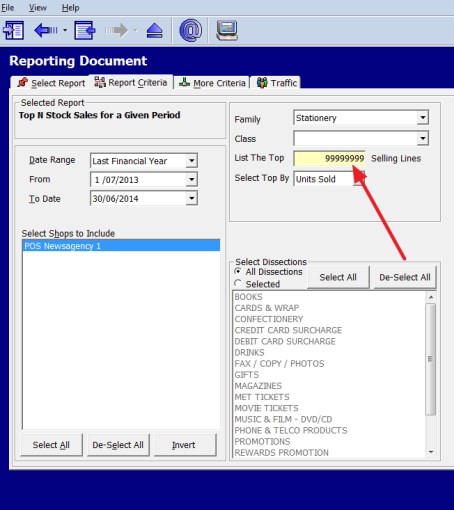
Now, select your criteria; I used the stationery department because it's a simple department that most people could relate to. Furthermore, the note marked in red indicates that I put 99 million in for the number of items needed to get everything. I also picked a whole year, as small periods can have fluctuations that can muck up the long-term trends.

Now I have this report.

I imported the data into Excel, as shown here with the red arrow.

This then produced for me an Excel spreadsheet of my report.

That is the standard report, but now, I can change it to almost anything I want—ad hoc. This is the report I changed it to. Click on it for more details, and I will now explain how I did it.

Stock adhoc report

In my Excel spreadsheet, you will see that I have put all my variables on the right, so I can play with them later.

The first variable I need is D, which is the ordering quantity of the item. I have that here as units, so that problem is solved. All I need to do is divide it by 52 weeks a year, so column M2 =G2/52, and I copy it down.

I have to determine the cost of ordering. It takes the department about two hours for someone to process an order and another hour to process the order when the goods come. Say three hours plus some extras, say about $150. Since I have 247 items in this department, that works out, too.

k = $150/247 = 0.60728745

Now, we need the holding cost (h), which is the holding cost.

I explained how I get my stock-turns here, and it's 10 for this stationery department.

I would say for a year, we are looking at the interest of money plus shoplifting of about 1.5%, so say about 14%, so per week, that works out to 14%/52 weeks a year, about .2%, plus there is a rental on the building. This is something you need to determine. I suggested before that you go to your last year's profit and loss to resolve this. What is the cost of the space that you require to sell an item? When they do this, many report to me how stunned they were just how high that figure is. In this case, as I do not know it, I am setting it to zero.

Now, I need the stock on hand. I could use the figure that is there, but it suffers from the short-term fluctuations I mentioned above, so I prefer to use the yearly figure. I need to subtract the profit from the sales and divide it by the stock turns.

So, I make a formula (Sale$-Profit$)/stock turn in this Excel sheet, which is =(J2-H2)/$R$1, my SOH figure.

My h is now (SOH) x h + Fixed h, and you can see the column there marked N.

Now, my EOQ is easy to determine as it =SQRT(2*M2*$S$2/N2) and copy that down.

Since I am working in weeks, I did that 52 weeks and divided it by my EOQ.

The formula suggests that I should look at it every two or three months, which makes sense as stationery is a small department in this store with sales of about $3000 annually. However, there are certainly more important departments that the shop should investigate.

Now, I would change the figure, increase or decrease the stock turns, the holding costs, etc., to see what happens.

Common Mistakes When Implementing EOQ

Although EOQ is a valuable tool, there are some problems people commonly come up with when trying to use it:

  1. Ignoring variability: It assumes constant demand, which often needs to be corrected, e.g. Xmas stock or Mother's Day stock.
  2. Overlooking many costs: You need to include all the ordering and holding costs, including some less obvious ones like breakage and obsolescence. 
  3. Not updating regularly: As market conditions and costs change, you must periodically review your EOQ calculations; I suggest yearly.
  4. Perishable goods: It assumes that all items do not perish or have a marketing cycle, e.g. A magazine is monthly, and milk cannot be kept.
  5. Forgetting about lead times: It does not account for supplier lead times, particularly for items ordered from the net.
  6. Neglecting order quantity: It assumes you can order as little as you require; some suppliers have minimum orders.
  7. People's natural rhythm: People can be instructed to do the task once a week, every two weeks, or monthly, but it's a bit hard to tell then every 12 days. We do live in a real world.
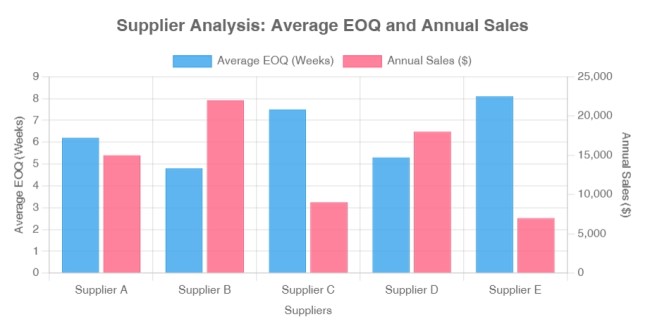
  8. Often shops tend to have to do it by supplier not department: When you start to break down the figures to smaller sections of the shop you get results all over the place.I got this when I looked by suppliers, where you can see the problem.

    EOQ does by suppliers

    I suggest that you keep it simple and do it by department.

Wrapping Up

Remember, good inventory management isn't just about crunching numbers. It's about ensuring profitability is not sacrificed due to poor procedures. This is just one piece of the puzzle.

If there's enough interest, I will do a webinar on this topic and incorporate it into our software. So, let us know what you think!

Did you try to calculate EOQ for your shop? Please tell me what you found. I'm interested in hearing about your experience. Your practical experience is valuable to us, whether you have any questions or just want to share your thoughts.

Frequently Asked Questions (FAQ)

Here is an FAQ to answer some of your questions on the topic

Q1: What is Economic Ordering Quantity (EOQ)? 

A: EOQ is a scientific method used to determine the optimal quantity of inventory to order for the most profit.

Q2: Why is EOQ important for my business? 

A: EOQ helps maximize profitability by finding the sweet spot between overstocking (which ties up capital and space) and understocking (which can lead to lost sales).

Q3: Where can I learn more about implementing EOQ in my business? 

A: Links above were supplied, the Wikipedia has a decent article too here.

Q4: Do I need special software to calculate EOQ? 

A: No. While specialized software can help, you can calculate EOQ using Excel or OpenOffice spreadsheets using your POS System.

Q5: How often should I recalculate my EOQ? 

A: As market conditions and costs change, you should review and update your EOQ calculations. I think yearly should be enough. 

Q6: Can EOQ be used for all types of inventory? 

A: I think even if it is not applicable, the figures it produces, even if you have perishable goods or items with very short marketing cycles, are interesting.

Q7: How does EOQ relate to my Point of Sale (POS) system? 

A: Many modern POS systems are required to provide the information needed for EOQ calculations.

Q8: Is EOQ the only inventory management method I should use? 

A: No, EOQ is one tool among many.

Q9: Is this EOQ the only inventory formula for this use? 

 No, the EOQ formula has many variations, some of which might suit you better. Please let me know if you find one that you think is better.

How to get your Stock Shrinkage figure

POS SOFTWARE

Here is how you can calculate your stock shrinkage in just a few minutes. You do have the information now.

The Importance of Calculating Stock Shrinkage

Regular stock shrinkage calculations are essential for the following:

  1. Identifying inventory loss trends
  2. Implementing effective inventory control techniques
  3. Optimising your retail operations
  4. Improving your overall profit margins

How to Calculate Stock Shrinkage

Follow these steps.

Using the figures for the 2023/24 year:

  1. Determine your recorded inventory value: According to your records, this is the total value of stock. Your accountant should know this now.

  2. Conduct a physical inventory count: You should know this from your stocktake.

  3. Calculate the shrinkage rate:

    The Shrinkage Rate formula = (Recorded Inventory Value - Actual Inventory Value) / Recorded Inventory Value x 100


For example, if your recorded inventory value is $100,000 and your actual inventory value is $97,000, you have lost $3,000 of stock.

However, as stock shrinkage is commonly expressed in percentages, let's calculate this figure.

Shrinkage Rate = ($100,000 - $97,000) / $100,000 x 100 = 3%

Common Causes of Inventory Shrinkage

Understanding the reasons behind shrinkage is crucial for implementing effective inventory loss prevention strategies. These are the common reasons:

  1. Shoplifting
  2. Employee theft
  3. Administrative errors
  4. Supplier fraud
  5. Damage or spoilage

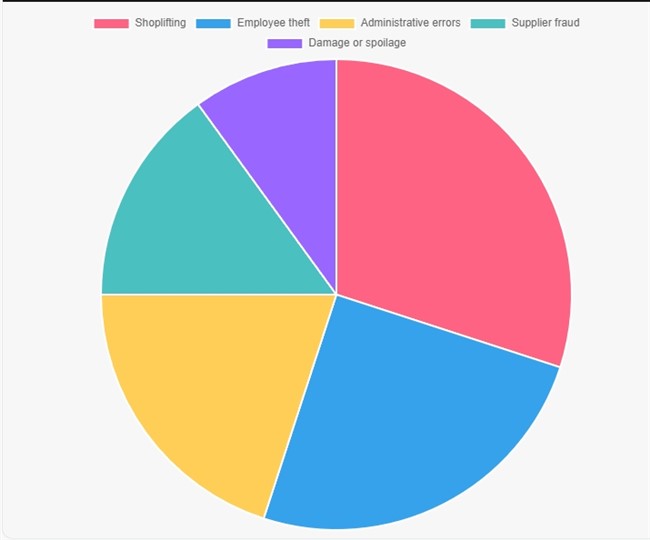
    When I did it for a client, I used departments, and we came up with this chart, which looks about right.

    Typical inventory shrinkage chart

The Role of Technology in Small Business Inventory Tracking

Investing in the right technology can significantly improve your inventory management:

  1. POS systems: Offer real-time inventory tracking and sales data.
  2. Camera: This is one of the few items that courts do accept.
  3. Security system: You do not need everything, just a sample, to significantly affect shoplifting.

Conclusion

Mastering stock shrinkage calculation and implementing effective inventory reduction strategies are crucial for optimising retail profit. By utilizing the right tools, such as a robust POS system for businesses and implementing vital inventory control techniques, you can minimize losses and maximize profitability in your brick-and-mortar store.


Add new comment

Restricted HTML

  • Allowed HTML tags: <a href hreflang> <em> <strong> <cite> <blockquote cite> <code> <ul type> <ol start type> <li> <dl> <dt> <dd> <h2 id> <h3 id> <h4 id> <h5 id> <h6 id>
  • Lines and paragraphs break automatically.
  • Web page addresses and email addresses turn into links automatically.
CAPTCHA This question is for testing whether or not you are a human visitor and to prevent automated spam submissions. Image CAPTCHA
Enter the characters shown in the image.

Complete Video Guide on mastering Stocktake

POS SOFTWARE

Now, at the end of the financial year, we are releasing this video, which provides a complete YouTube tutorial on how to do the physical count for a stocktake using our POS Software.

We walk you through this essential inventory management system and explain the options and best practices.  This video would be useful as a training and reference resource for anyone who needs to perform stock control using POSBrowser. 

It covers the two main approaches—doing the full shop at once or breaking it down into smaller location-based sections. Although both work, we advocate the location-based approach, which we find more efficient. Prepare your plan by dividing the shop into sections. Then, stocktake each section one at a time. This makes the process more manageable and accurate. 

The video demonstrates creating a new stocktake, correctly scanning/counting items, and correctly recording it. We also cover the necessary settings like "Check Stock Movement" if you are doing it during trading. It shows how to run reports to see discrepancies, cost valuations by department, and more. The reporting capabilities highlighted allow you to analyze and audit your stock position.

The clear explanations and visual demonstrations make it a valuable reference for new and experienced users. I suggest getting your staff to run through it, too.

"The integration between stocktake data and our ordering process has streamlined our operations significantly. We've reduced carrying costs, minimized stock-outs and given us accurate reporting." 

woman watching a youtube on Stocktake

Mastering stocktakes is essential for the success for any retailer.

Add new comment

Restricted HTML

  • Allowed HTML tags: <a href hreflang> <em> <strong> <cite> <blockquote cite> <code> <ul type> <ol start type> <li> <dl> <dt> <dd> <h2 id> <h3 id> <h4 id> <h5 id> <h6 id>
  • Lines and paragraphs break automatically.
  • Web page addresses and email addresses turn into links automatically.
CAPTCHA This question is for testing whether or not you are a human visitor and to prevent automated spam submissions. Image CAPTCHA
Enter the characters shown in the image.

Out of stock

POS SOFTWARE

Out of stock in retail

How to Avoid Losing Customers

It is frustrating when a customer comes in looking in your shop only to find you're out of stock. We all now how we feel when this happens. What is your customer now thinking, maybe of going to your competitor? 

The good news is this common issue can be largely avoided with our POS system. 

So here is how you can use the inventory features in our POS to avoid out-of-stock and keep customers coming back.

What is "Out of Stock"?

Out of stock means a product is unavailable for purchase because you don't have any left in your store. It is said here to account for about 8.3% of all shopping trips. It's a lot.

What we have now is a missed sale and a disappointed customer.

This is extremely common when

- An obscure holiday is occurring that some of your customers follow and you have forgotten to buy stock for them

-If have run out of stock and not realised it.

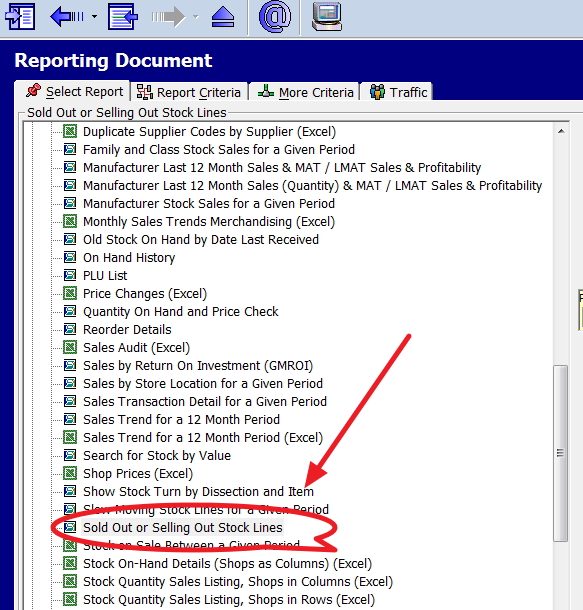
Use the "Sold Out or Selling Out Stock Lines" Report

Our POS system has an extremely handy report called "Sold Out or Selling Out Stock Lines".

It will take you seconds to run and save you thousands.

Here's how to use it:

  1. Go to Reports > Stock
  2. Select "Sold Out or Selling Out Stock Lines"

What you want is to pick a period last year of the same date as now to compare.


These products need to be checked ASAP. This can help you make sure you have adequate stock.

Moreover

It also alerts you whether items are not properly entered into your system as the stock-on-hand figure is negative, as shown in the example below.


I recommend running this report weekly to stay on top of stock levels.

The Risks of Out-of-Stock

Why go to such trouble to avoid out-of-stock issues? Well, the fact is that your customers will tolerate this situation only a few times before taking their business elsewhere.

Well, most of your regular customers tend to follow a "three strikes, and you're out" pattern:

  • Strike 1: The first time a product is out of stock, the customer substitutes 70% of the time, and 30% go elsewhere.
  • Strike 2: The second time, they may substitute, not buy anything, or go to another store.
  • Strike 3: The third time, they switch stores 70% of the time—losing you their business.

Today, customers have little patience for out-of-stock. They will quickly take their business to retailers that reliably stock what they want.

So stay on top of your inventory with our POS system! Run stock reports weekly, keep high-demand products well-stocked, and avoid frustrating your customers. 

Add new comment

Restricted HTML

  • Allowed HTML tags: <a href hreflang> <em> <strong> <cite> <blockquote cite> <code> <ul type> <ol start type> <li> <dl> <dt> <dd> <h2 id> <h3 id> <h4 id> <h5 id> <h6 id>
  • Lines and paragraphs break automatically.
  • Web page addresses and email addresses turn into links automatically.
CAPTCHA This question is for testing whether or not you are a human visitor and to prevent automated spam submissions. Image CAPTCHA
Enter the characters shown in the image.

Automating your replenishment processes

POS SOFTWARE

Most of your suppliers have large numbers of items on the catalogue. Even many small clients of ours would be selling actively over a year, selling over 43,000 lines. Your point of sale (POS) software can quickly give you a list of your inventory management. Smaller retailers sell less than large retailers but sell the same goods. That is a lot of work if you order once a week to handle it. Just calculate how much it costs you now to order stock.

Those who do not computerise it tend to do much of the ordering on gut feel and memory.

However, getting it right is critical to retail business success as we need to get the shoppers what they want and when they want it. This is particularly difficult if you deal with products with high decay, e.g. popular magazines, fresh food, etc., because then we have the problem of availability vs waste.

Inventory management is one of the most critical operations in retail. Ensuring adequate stock levels to meet customer demand takes careful planning and excellent forecasting skills. For most retailers, the replenishment process involves a lot of manual work, guesswork and frustration. But our POS Software offers a better way – retailers can revolutionise inventory management by automating replenishment.

The Challenges of Manual Replenishment

Traditionally, reordering stock is an entirely manual process for retailers. Staff pore over existing stock and review the massive catalogues from various suppliers to select items and quantities to purchase each week. This tedious approach to Retail inventory is problematic for several reasons:

Guessing Order Quantities

Without scientific forecasting, employees guess at order amounts based on intuition and memory. It’s virtually impossible to predict demand across an extensive product range this way accurately.

Time-Consuming

Manually calculating and entering purchase orders can take days of staff time every week. As the business grows, more labour hours get eaten up by this low-value activity.

Risk of Stockouts

Guessing order quantities often leads to stockouts when demand exceeds forecasts. Out-of-stocks result in missed revenue and poor customer experiences.

Excess Inventory

Just as dangerous, overestimating demand frequently causes overstocking. Excess inventory leads to higher carrying costs and waste.

Unbalanced Supply Chain

With no real-time visibility or coordination, discrepancies between inventory levels and supplier ordering accumulate over time. This strains the supply chain.

Imprecise Tracking

Lacking any automated analysis, inventory tracking relies on employees manually monitoring and recording stock counts. This is prone to error over a large catalogue.

Automated Replenishment

It looks at your sales history, forecasts current demand using Demand forecasting, and creates the ideal stock quantity you require now. 

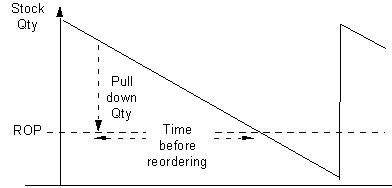
If you order frequently, the amount of stock you need until the next reorder is less. It then compares this figure to the actual stock-on-hand figure you have, adds some safety stock, considers the ordering requirement of each supplier, and prints or issues a stock order with almost no work.

This reduces your holding costs, as you are not holding much stock.

You will save a lot of time, and your shop will undoubtedly do a better job of it.

Our automated inventory management platforms provide a sophisticated solution to these challenges. By using smart forecasting algorithms and inventory sensors, they streamline replenishment to optimise stock levels.

Forecasting

Replenishment systems automatically collect sales data and use machine learning to detect demand patterns for every product. Granular forecasts maximise availability while reducing excess inventory.

Flexible Reordering Strategies

The software allows setting custom reorder points and lot sizes tailored to the demand profiles of each item. Strategies like Min/Max and Just in Time are easily implemented.

Continuous Monitoring

Real-time inventory tracking provides complete visibility across the entire catalogue at all times. The system knows precisely when to trigger reorders to align with demand.

Streamlined Procurement

Purchase orders can be automatically generated and sent to suppliers when stock hits reorder points. This eliminates manual order creation work.

Optimised Delivery Logistics

Our replenishment systems can coordinate with your transport providers to help schedule deliveries.

Enhanced Supply Chain Visibility

Stock sales and holding information provide end-to-end transparency across the supply chain. Any bottlenecks or issues can be rapidly identified and addressed.

Evaluating Replenishment Automation Systems

With many solutions now available, choosing the right replenishment platform is critical. Here are the essential capabilities to look for in assessing systems:

Inventory Monitoring – real-time tracking across all stock items in your warehouse and shop with detailed inventory analytics.

Forecasting Accuracy – advanced AI with machine learning and statistical algorithms to maximise the forecast precision.

Order Optimization – balancing target inventory levels, supply constraints, logistics costs and supplier requirements.

Analytics & Reporting – actionable insights into sales, stock levels, supplier performance, waste reduction and other KPIs.

Customer satisfaction  – By better inventory best practices, you increase customer service.

The right solution will tailor the capabilities to your business’s specific needs and allow custom configurations. 

Our Point of Sale platform provides the most flexibility, scalability and hands-off maintenance.

Realizing the Benefits of Automated Replenishment

Implementing a robust inventory management system unlocks enormous benefits:

Increased Sales

By aligning stock levels with demand and minimizing stockouts, automation enables higher sales and conversions. Customers can find the products they want every time.

Lower Inventory Costs

Carrying excess stock ties up working capital and incurs storage, handling, insurance and spoilage costs. Automating replenishment optimizes inventory investment.

Improved Efficiency

Automation eliminates the hours of manual work traditionally required, allowing staff to focus on more value-added priorities.

Enhanced Forecasting

Automated algorithms crunch enormous amounts of data and detect subtle patterns more accurately than humans. Forecasts improve continuously through learning.

Reduced Waste

Intelligent inventory management avoids overstocking and enables dynamic pricing of perishable goods or expiring products. This cuts waste costs.

Supplier Relations

As a retailer, you are at a disadvantage. Suppliers have far more visibility into true consumer demand and know much more about their product sales in your shop. This allows them to dictate terms around inventory management and delivery schedules to your shop.

Implementing automated replenishment finally gives retailers the data needed to rebalance these partnerships.

With an inventory management system tracking every product in real-time, retailers can gain visibility of their stock that exceeds suppliers' knowledge. You are no longer reliant on the piecemeal date suppliers share.

This allows retailers to optimise orders based on projected demand rather than supplier convenience. Suppliers must become more accommodating to fulfil the order quantities, frequencies and delivery windows specified by the retailer's replenishment algorithms.

Suppliers benefit from retailers sharing their sell-through data. But this is controlled - retailers decide what insights to provide each supplier. This prevents suppliers from misusing the data or acting contrary to the retailer's interests.

Automated replenishment flips the script on the retailer-supplier power dynamic. Retailers can finally dictate the inventory planning relationship rather than relying on supplier practices. This shift rebalances the partnership and benefits the retailer's bottom line.

Start Your Automated Replenishment Journey

If managing inventory still feels like a guessing game rather than a science in your operations, it’s time to explore automated solutions. The technology is more accessible than ever. Replenishment automation unlocks data-driven inventory management, allowing retailers to thrive.
Contact our team today to discuss the best options for your business!

Add new comment

Restricted HTML

  • Allowed HTML tags: <a href hreflang> <em> <strong> <cite> <blockquote cite> <code> <ul type> <ol start type> <li> <dl> <dt> <dd> <h2 id> <h3 id> <h4 id> <h5 id> <h6 id>
  • Lines and paragraphs break automatically.
  • Web page addresses and email addresses turn into links automatically.
CAPTCHA This question is for testing whether or not you are a human visitor and to prevent automated spam submissions. Image CAPTCHA
Enter the characters shown in the image.

Under-ordering stock is sometimes better

POS SOFTWARE

Retail stock control

Running out of stock on key products can be devastating for a retail business. For example, a pharmacist told me recently when I came to pick up medicine, "I asked a customer to come back because I didn't have the medication in stock. They came back. Later he came back with a different script and I didn't have that either, so he left and I never saw him again." Clearly, keeping enough stock of core products is critical.

However, this logic does not always apply to non-essential, temporary, or promotional items.

The Risks of Overordering

A while ago I remember Frozen II merchandise was taking off. While it was selling rapidly at first, soon demand dropped significantly. If a retailer had over-orders, they would risk being stuck with surplus stock that would have to be heavily discounted.

"There is a genuine danger that a retailer who over-orders will be left with product that needs to be heavily discounted to get rid of."

When Under-Ordering Makes Sense

In cases like Frozen II goods above, under-ordering may actually be the wiser move. Here are some benefits:

  • Avoids surplus stock needing to be sold at a loss
  • Creates product scarcity, increasing perceived value
  • Gives a chance to explain high demand and offer to order more
  • Costs less, so saving you money

Leveraging Point of Sale Software

Whatever your ordering strategy, having the right point of sale and inventory management software is essential. It provides visibility into current stock levels so informed choices can be made on replenishment orders. This helps minimize waste while preserving customer satisfaction.

Streamline your inventory management with a point-of-sale system that seamlessly automates reordering. Our solution empowers you to replenish stock frequently without overburdening your staff. Let us simplify your inventory management process.

Let us show you how our POS software can help you master retail stock management. 


Add new comment

Restricted HTML

  • Allowed HTML tags: <a href hreflang> <em> <strong> <cite> <blockquote cite> <code> <ul type> <ol start type> <li> <dl> <dt> <dd> <h2 id> <h3 id> <h4 id> <h5 id> <h6 id>
  • Lines and paragraphs break automatically.
  • Web page addresses and email addresses turn into links automatically.
CAPTCHA This question is for testing whether or not you are a human visitor and to prevent automated spam submissions. Image CAPTCHA
Enter the characters shown in the image.

Negative Stock (Inventory): How to Find your Stock Discrepancies Fast

POS SOFTWARE

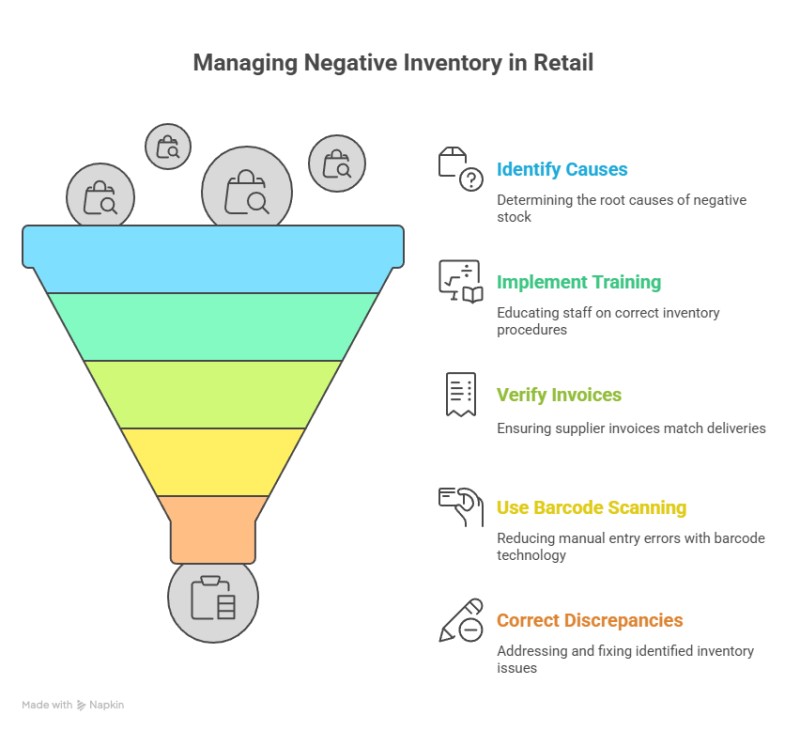
Negative inventory is when the inventory level of a stock item in your system shows less than zero. What it shows is that your records are inaccurate. The computer tells you you have sold more of this item than you had in stock.

This can, if not addressed, seriously harm your retail business in a few key ways:

> Reduces faith by you and your staff in your inventory management system. At best, you will waste time second-guessing inventory counts. At worst, it is an advertisement to your staff that you do not know your stock figures.

> It distorts your reports system-wide. These negative stock figures often get included in your information.

> It means you have no stock control on many items.

Common Causes of Negative Inventory

Negative inventory typically arises from these problems:

> Inaccurate manual counts at stocktaking, there is a lot to count, and errors do happen.

> Data entry mistakes by your suppliers coming through their electronic invoices or by people in your shop inputting stock quantities.

> Failing to enter invoices before selling makes problems.

So it is best to correct any negative inventory situations. Here are some best practices for controlling negative inventory:
Finding the negative stock

Fortunately, we have a quick and easy way to check stock quantities for what you have on hand.
 
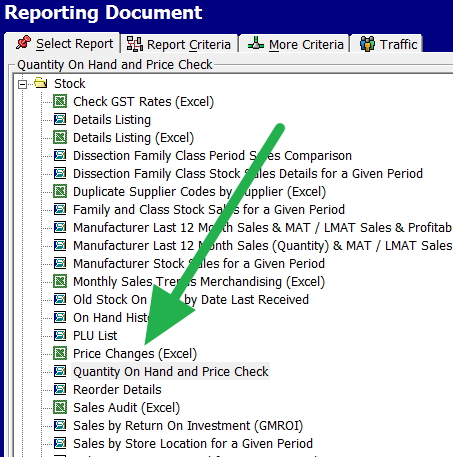
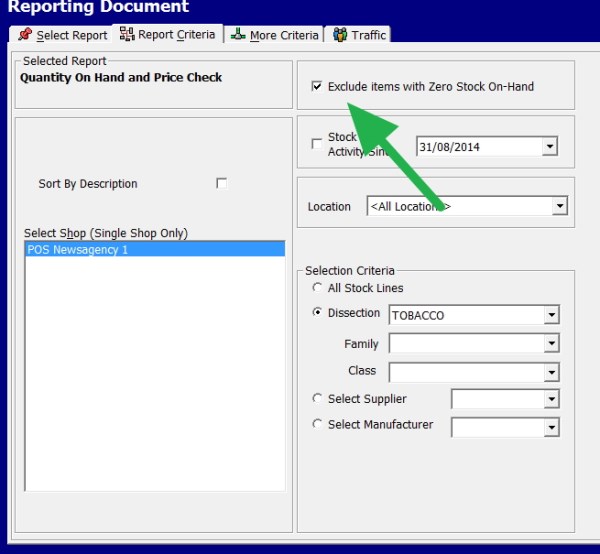
Go to reports. There is an option for Quantity On Hand and Price check; click on that.


POS Software menu


We exclude those items that have zero stocks. 
 
I suggest doing it by department so in this example, I picked the dissection (department) tobacco. 
 

POS Software On hand and preice options


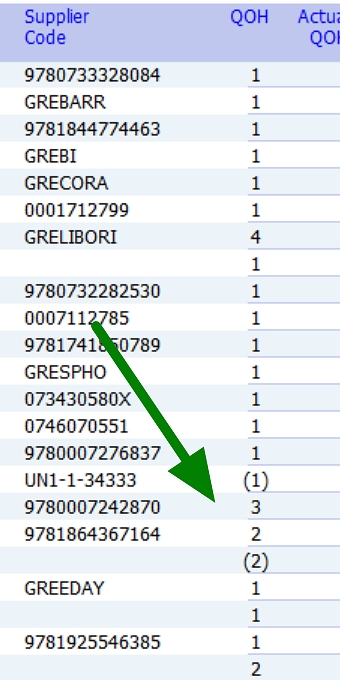
Now outcomes a report listing the details of your item, looking at the quantities on hand in the column QOH, you may see items in brackets, see green arrow below, these are the negative Stock Discrepancies.


At first, you will find it a lot of work to fix it, but once done, it's relatively quick.

You should frequently check this report for negative stock values, say monthly.

Now audit these negative items to determine what went wrong in your inventory management system.

Conclusion

With proactive prevention and early detection, negative inventory can be handled. Leverage tools like our reports to stay on top of your stock quantities.

Let us know if you have any other questions!

Add new comment

Restricted HTML

  • Allowed HTML tags: <a href hreflang> <em> <strong> <cite> <blockquote cite> <code> <ul type> <ol start type> <li> <dl> <dt> <dd> <h2 id> <h3 id> <h4 id> <h5 id> <h6 id>
  • Lines and paragraphs break automatically.
  • Web page addresses and email addresses turn into links automatically.
CAPTCHA This question is for testing whether or not you are a human visitor and to prevent automated spam submissions. Image CAPTCHA
Enter the characters shown in the image.

Save Time and Money with Automated Inventory

POS SOFTWARE

stock in a shop

This is part of a proposal I will be releasing for POS Solutions on the benefits of using  Automated Inventory, I hope you like it. 

Keeping on top of inventory levels and movements is one of the biggest challenges retailers face. Manual approaches to tracking stock and purchase orders can be extremely time-consuming and prone to human error. This often leads to lost sales from empty shelves, bloated inventory carrying costs, and unnecessary labour expenses.

Fortunately, POS Solutions provides powerful automated inventory management tools that save retailers time and money.

Real-Time Visibility into Inventory

POS Solutions integrates directly with inventory databases, pulling out real-time stock count data. This gives retailers now their inventory levels across their entire business as stock quantities are updated automatically as items are sold.

Accurate and Automated Purchase Orders 

With an accurate inventory picture, POS Solutions can automatically generate purchase orders as stock levels fall below predetermined or computer-estimated focus AI levels. This prevents out-of-stocks while removing the guesswork from ordering. Orders are precisely matched to demand, avoiding overstocking.

Reduced Out-of-Stocks and Better Customer Service

POS Solutions significantly reduces missed sales opportunities from out-of-stocks by monitoring inventory in real-time and allowing reordering when stock gets low. Customers get reliable access to the products they want.

Optimized Inventory Levels and Carrying Costs

Granular analytics within POS Solutions provide insights into fast versus slow-moving inventory. This allows retailers to optimise stock levels in each location. Excess stock can easily be transferred to meet demand elsewhere in the business. The result is leaner inventories across the board. 

Decreased Labor Costs

Automated inventory management with POS Solutions eliminates employees' need for frequent manual cycle counts and stocktakes. Retailers save on labour while focusing staff on more value-added tasks.

Insights into Shrinkage and Theft 

Unusual inventory activities are flagged by POS Solutions, allowing potential shrinkage and theft issues to be spotted in real time. Problems can be addressed before inventory losses grow.

Streamlined Supplier Relationships

Automated purchase orders and inventory tracking via POS Solutions improve supplier communication and coordination. Deliveries arrive when needed.

The Bottom Line

Automating inventory management via POS Solutions delivers game-changing benefits for retailers, including reduced out-of-stocks, lower carrying costs, optimized inventory, decreased labour spending, and minimised inventory shrinkage.

By implementing POS Solutions stock control, you can manage your stock more efficiently, improve customer service, and boost profitability.

Add new comment

Restricted HTML

  • Allowed HTML tags: <a href hreflang> <em> <strong> <cite> <blockquote cite> <code> <ul type> <ol start type> <li> <dl> <dt> <dd> <h2 id> <h3 id> <h4 id> <h5 id> <h6 id>
  • Lines and paragraphs break automatically.
  • Web page addresses and email addresses turn into links automatically.
CAPTCHA This question is for testing whether or not you are a human visitor and to prevent automated spam submissions. Image CAPTCHA
Enter the characters shown in the image.

Using your POS Software to find your Unsellable Easter Stock

POS SOFTWARE

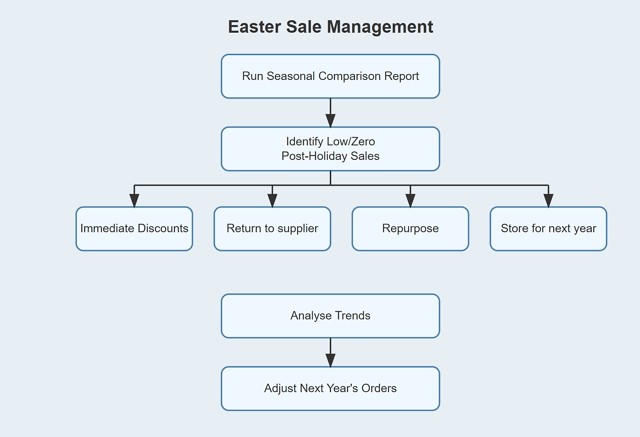
Seasonal holidays have difficulties with stock that only sells in the season. One such occasion is Easter, which you are expected retailers to load up with stock items that become unsellable after the season is over. The problem here is that not all this Easter stock is unsellable. 

Fortunately, with our POS Software, retailers have a powerful tool to help them find this unsellable stock. This tool can determine many items sold during Easter but will probably not sell after by following this step-by-step procedure.

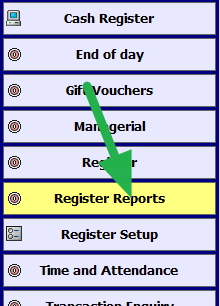
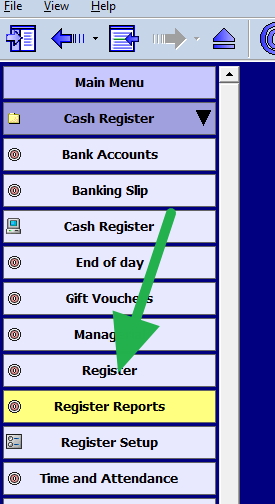
Go to Register Reports, which is marked in green, and then select "Stock Sold During Period(a) Not Sold in Period(b)" from the in-stock section.

Now select in stock, "Stock Sold During Period(a) Not Sold in Period(b)"

Now make (a) the Easter period as 02/04/23 to 17/04/23, which is a week before and a week after Easter, and compare it with (b) the period 24/04/22 to 24/07/22. 

You will now get a hit list of products to check.

Conclusion

You need to be able to manage their stock effectively. I strongly advise you to utilise this report to help manage your stock and maximise profits effectively.

Executive summary

> Due to stock that only sells during the season, like Easter, seasonal holidays can be challenging for retailers.
> Our POS Software can assist you with tracking down unsellable stock 
> This report will give you a hit list of such unsellable products.


Add new comment

Restricted HTML

  • Allowed HTML tags: <a href hreflang> <em> <strong> <cite> <blockquote cite> <code> <ul type> <ol start type> <li> <dl> <dt> <dd> <h2 id> <h3 id> <h4 id> <h5 id> <h6 id>
  • Lines and paragraphs break automatically.
  • Web page addresses and email addresses turn into links automatically.
CAPTCHA This question is for testing whether or not you are a human visitor and to prevent automated spam submissions. Image CAPTCHA
Enter the characters shown in the image.

Using your POS Software to find your Unsellable Easter Stock

POS SOFTWARE

Seasonal holidays have difficulties with stock that only sells in the season. One such occasion is Easter, which you are expected retailers to load up with stock items that become unsellable after the season is over. The problem here is that not all this Easter stock is unsellable. 

Fortunately, with our POS Software, retailers have a powerful tool to help them find this unsellable stock. This tool can determine many items sold during Easter but will probably not sell after by following this step-by-step procedure.

Go to Register Reports, which is marked in green, and then select "Stock Sold During Period(a) Not Sold in Period(b)" from the in-stock section.

Now select in stock, "Stock Sold During Period(a) Not Sold in Period(b)"

Now make (a) the Easter period as 02/04/23 to 17/04/23, which is a week before and a week after Easter, and compare it with (b) the period 24/04/22 to 24/07/22. 

You will now get a hit list of products to check.

Conclusion

You need to be able to manage their stock effectively. I strongly advise you to utilise this report to help manage your stock and maximise profits effectively.

Executive summary

> Due to stock that only sells during the season, like Easter, seasonal holidays can be challenging for retailers.
> Our POS Software can assist you with tracking down unsellable stock 
> This report will give you a hit list of such unsellable products.


Add new comment

Restricted HTML

  • Allowed HTML tags: <a href hreflang> <em> <strong> <cite> <blockquote cite> <code> <ul type> <ol start type> <li> <dl> <dt> <dd> <h2 id> <h3 id> <h4 id> <h5 id> <h6 id>
  • Lines and paragraphs break automatically.
  • Web page addresses and email addresses turn into links automatically.
CAPTCHA This question is for testing whether or not you are a human visitor and to prevent automated spam submissions. Image CAPTCHA
Enter the characters shown in the image.

Maximising your Products with Visuals

POS SOFTWARE

Step-by-Step Guide to Showcasing your Products with Pictures

If you have a customer display, customers like to see a picture of the item as it is scanned. The image is superior to writing as it is much easier to see than writing on the screen. Additionally, it is helpful because others in the queue can observe what people are purchasing from you at a distance. This is a simple way of making you look more professional, increasing sales and improving your service.

To do this, you need to add photos to your stock items. It is simple, and I will show you how to do it here. If this all will sound hard, it is not, and it is a valuable skill you will find helpful outside of work.


Preparation

You only need to do some things in the shop; the top 50 items are often enough to start. Once you get going, you can always get more.

So what we need are our top 50 items to start. You know it already, but if you want a computer listing, do the following.

Follow this, and in this instant, you can precisely know, track, and control your top-selling products in real time. 

Go to Register reports.


Report of stock maintenance

Now pick "Top N Stock Sales for a Given Period." I suggest the last two months.


Top selling report in a retail shop


Now you have your hot list, which took less than a minute to do.

A bonus here is that you will see items you may find much more interesting here.

Getting the photos

It is not hard, and over the years, I have changed my mind about the quickest and easiest way to get the photos.

Ask your supplier (Old method)

You can ask your suppliers.

Pros: These photos are often perfect.

Cons:

> Each supplier handles only a small number of your products. There are many suppliers to ask.

> It's a hassle to find the right person in an organisation to ask

> Surprise they do not have everything

> It takes ages to get it

> Often, the photo is in strange computer formats that are hard to use.

Now, this is the big problem. The pictures are not yours. I have spoken to several suppliers on my client's behalf and told them they could use them verbally, but only some have agreed in writing. Even if they put it on paper, which is rare, clauses are attached.

Royalty-free places on the web

There are many royalty-free places on the web where you can get them.

For example, there are many royalty-free places on the web to get them.

https://pixabay.com/en/photos/

https://unsplash.com/

A picture of an apple for POS Software

I grabbed a picture of an apple from one of them.

Pros: Good photos

Cons:

> The big problem is, besides some standard groceries like the apples above, it's hard to get branded items. No one will be happy if, for butter, you show a genetic picture or, even worse, an image of butter from another brand.

> It takes time to find the images

>Legal problems might arise.

Get a professional photographer.

Pros: Good pictures

Cons:

> costs.

> Lack of flexibility

Do it yourself.

Having done it a few times, I have found it quick and easy to do with a modern smartphone. Modern smartphones are more than good enough.

You will need a tripod. A decent one is about $30. If you do not have one, well, get one before starting.

You are looking at an hour and a half of work.

Set-Up

A bathroom works great if it has a window to the sun. Set up a table in the room, put some cardboard on the table, and you are off.

If you want something better, you will need a reading lamp, a large cardboard box, oven paper, white cardboard, the smartphone and then watch this youtube explaining how to do it.

Set up your photo area. Remember that in photography, lighting is crucial, especially when taking pictures of small things. Now take pictures of a few sample items. You must ensure your items are well-lit and do not have shadows.

Set the image setting on the camera.

Adjust the image settings on your smartphone until you achieve a good visual output. While professionals may prefer manual settings due to their experience and knowledge, amateurs with limited knowledge will find the automatic mode more suitable for their needs. So I suggest using an automatic setting here.

Activate burst mode's automatic setting on your smartphone.

When you are happy with the pictures you get, you can start photographing your items.

Preparing your stock items

It works better with two people. One positions the items, cleans and takes the pictures, and the other collects them, bringing them in and then putting them back. 

Before the photo is taken make sure your items are clean and free of fingerprints and dust.

Taking the picture.

It's time to take the pictures.

> Put the item in; while doing this, consider its position. Most items are best shown from an angle.

> Take about five to ten shoots per item.

Putting in your computer

There are services like google photos that will automatically move the images from your smartphone to your computer. Use one such service. After they are in your computer, review each stock item and select the best one while deleting the others. Avoid taking excessive time deciding which to pick. If it is hard to determine, it does not matter which one you choose for this purpose.

Adding the Photos to Your Stock Items

Now that your pictures are prepared, it's time to add them to your stock items. 

Now call up the item you wish to add the photo, for example, here oranges

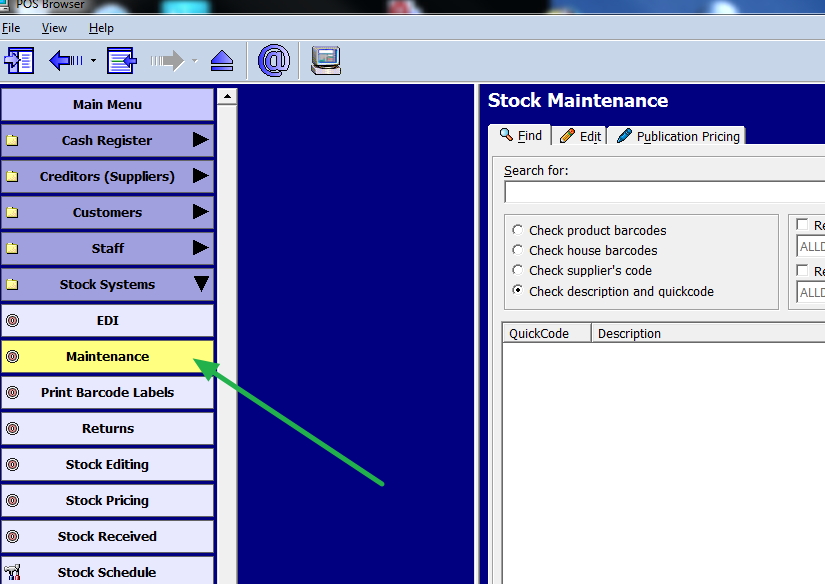
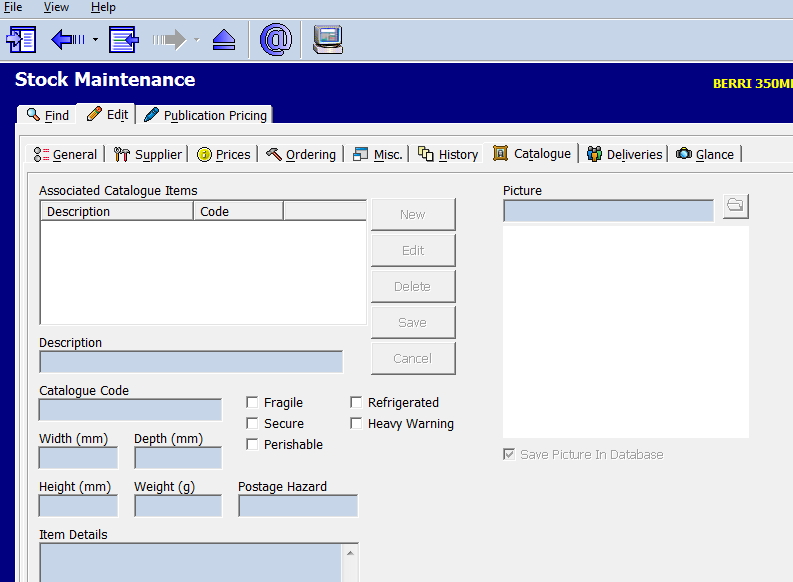
Now go into stock maintenance.

stock maintenance


Now call up the item, here it will be oranges


Calling up stock item

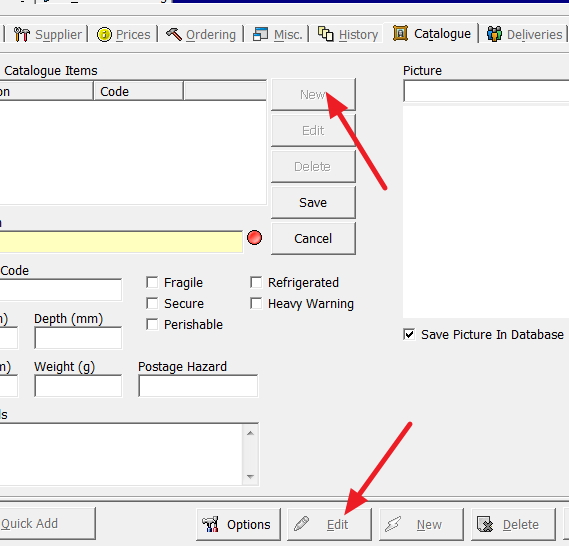
After that, go to the catalogue section, click edit and then new to add a new photo.


stock mantenance

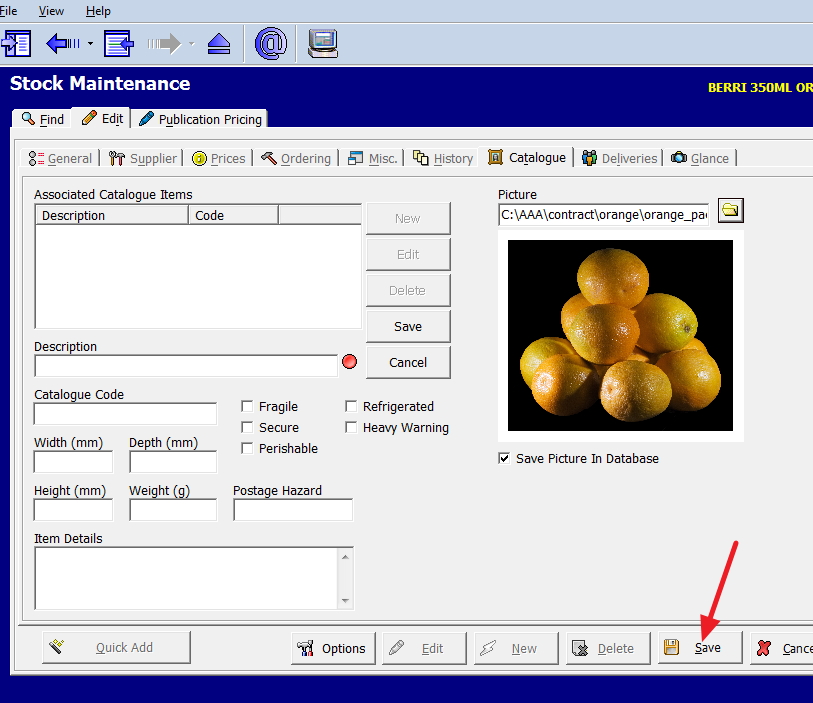
Then select my image and save it. 

Adding image to retail stock

Now you have attached the image.

Conclusion

Including pictures of your stock items can help improve the appeal of your listings and boost sales. You can easily take great photos and add them to your stock items by following these steps and tips.

Enjoy your photography!

Add new comment

Restricted HTML

  • Allowed HTML tags: <a href hreflang> <em> <strong> <cite> <blockquote cite> <code> <ul type> <ol start type> <li> <dl> <dt> <dd> <h2 id> <h3 id> <h4 id> <h5 id> <h6 id>
  • Lines and paragraphs break automatically.
  • Web page addresses and email addresses turn into links automatically.
CAPTCHA This question is for testing whether or not you are a human visitor and to prevent automated spam submissions. Image CAPTCHA
Enter the characters shown in the image.

How to build your Basket Size? 

POS SOFTWARE

How to build your Basket Size? 

The retail basket size is the average number of items in a customer's transaction.

Study shows that the largest 20% of shopping baskets on average generate 50% of unit sales, and 40% of dollar revenue. That is huge if you think about it. What it shows is that the size of the basket accounts for much of a company's profits, so knowing this metric is essential. So we will discuss methods for increasing retail basket size and how to measure it.

Theory of basket size

Getting customers to buy something is a big business problem. In practice, they often do buy more after deciding to make one sale. The second item is often less competitive because the customer evaluates the first product more than the second. Often to the retailer, there is more money in the addon sales than the core.

Time

Getting customers to spend more time in your shop is one of the most important ways to increase the size of their baskets. Studies show consumers make more purchases the longer they spend in a store. For example, people in superstores buy more because they spend more time in them. One way to get customers to spend more time in your store is to offer in-store experiences. Bunning, for example, with their free classes on hardware, knows what they are doing.

Products for the size of a basket

You need items that sell with other products. What you will see are these products in your companion reports. Consider these recommendations.

Navigate to Sales-Register > Dissection Companion Sales by Period in your POS software.

Increase your basket size with impulsive items.

Try looking for the items that sell more than other products. You should ensure that these items are prominently displayed. To maximize and increase sales, majors often show these items in many locations under different categories. For example, a Christmas Card can be shown in the Card department and the Christmas section.

Finding these Companion items

In your POS software

Go to Sales-Register > Dissection Companion Sales by Period.

Look for items that sell well with other departments. It is beneficial as it can help you select a product to display near a department prominently. This is a well-known method of increasing incremental sales that all majors use.

You take items that sell well with that department and place them in that department's area. There is nothing wrong with a good seller having a few spots in the shop. 

Also, moving products by type rather than supplier, e.g. moving some of the chocolates other businesses produce closer to Darrel Lea Chocolates, could result in many more sales. Darrel Lea might not like that, but...

As you can see here by the green arrow, the books should be close to the stationery.

I've noticed that phone recharges in tourist areas help sell other products and are worth handling despite having little value in themselves.  

Now, if you've found these things, you should look at the following:

Design of the store

If the layout and design of your store are clear, it will be easier for customers to find what they're looking for. This makes it more likely that they will buy something. Goods that are impulsive sales should be visible. 

Promotions.

Retailers can use sales and promotions to get customers to buy their products if they have the right ones. Increasing the size of a customer's basket encourages repeat purchases.  

Product bundling

By making bundles of products, retailers create more customers who will buy more.

Measuring the Size of a Retail Basket

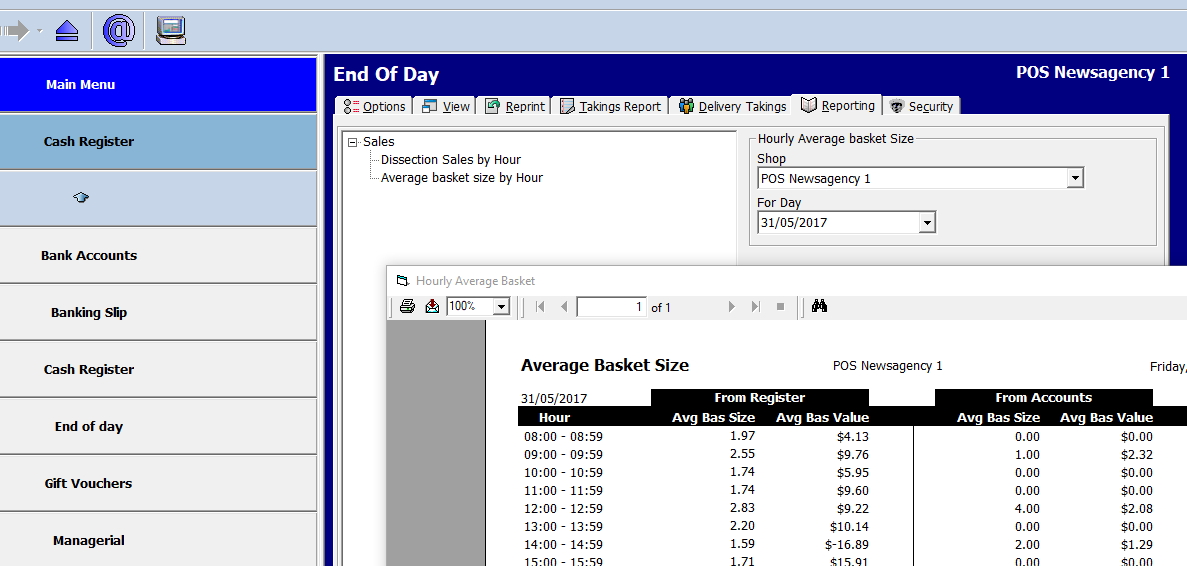
Navigate to End of Day > Reporting > Average Basket Size by Hour (picture)

Understand and optimize your basket size with data analysis

Then enter a date to observe how the size of a retail basket changes depending on the time of day in your store. The time can be significant. Find out why?

We've broken it down by account and retail sales; Generally, we observe larger basket sizes in account sales. 

Conclusion

You can increase the basket's size in various ways.  The most apparent benefit of increasing a basket's size

> It increases total revenue and sales. Profit rises in tandem with higher sales. 

> Customers are more likely to return to a store and make more purchases if they spend more money with you. This also increases their lifetime value as a customer. 

> If you are shipping, you reduce the costs of handling transactions, shipping, and logistics by increasing the basket size.

Add new comment

Restricted HTML

  • Allowed HTML tags: <a href hreflang> <em> <strong> <cite> <blockquote cite> <code> <ul type> <ol start type> <li> <dl> <dt> <dd> <h2 id> <h3 id> <h4 id> <h5 id> <h6 id>
  • Lines and paragraphs break automatically.
  • Web page addresses and email addresses turn into links automatically.
CAPTCHA This question is for testing whether or not you are a human visitor and to prevent automated spam submissions. Image CAPTCHA
Enter the characters shown in the image.

How to Check Your Items, No Longer On Sale, but Marked Down

POS SOFTWARE

How to Check Your Items, No Longer On Sale, but Marked Down

The problem

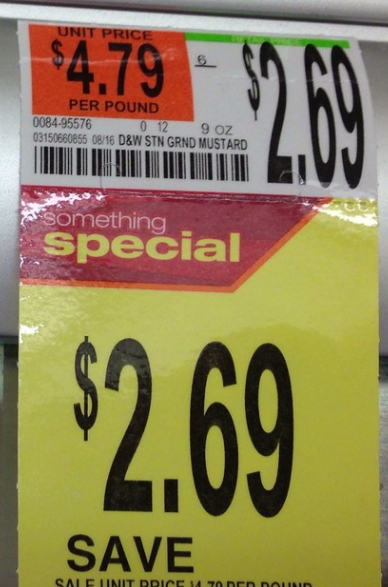
Today many of you currently have items with discounts for the Christmas season that are still marked down on the label; however, this sale has ended. It can be challenging to ensure that you have found all these markdown items. As such, you risk

>either selling those items at the wrong price

>or arguing with a customer about why you are not honouring that price on the label.

Shoppers use this popular technique to get bargains, looking for items wrongly marked. Bargain sites frequently mention such shops with wrongly marked merchandise.

To stop this, you must identify those items and change their prices on the label to avoid this problem.

Most stores have to go through their inventory and physically check whether all the items are still on sale, a very time-consuming task, but you have a better way.

Finding Out-of-Sale Items

You can run a unique report from your point-of-sale system showing all the off-sale items. Check these items off; doing this will save time and money.

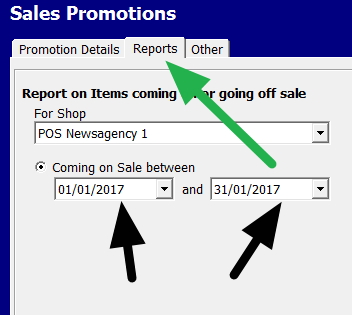
Go to the stock system > Select Sales Promotion here.

A screenshot for the option to select for a report showing items on sale and their sale prices


Select reports (marked with Green)

A screenshot for a report showing items on sale and their sale prices


Now select the dates marked with the black arrows, and you'll see a report of all items with a sales price change in this period. Next comes a list of all items affected for you to investigate

Conclusion

Doing this can ensure that you are selling your items at the correct prices and avoid confusion and pricing errors over items going off sale.

Add new comment

Restricted HTML

  • Allowed HTML tags: <a href hreflang> <em> <strong> <cite> <blockquote cite> <code> <ul type> <ol start type> <li> <dl> <dt> <dd> <h2 id> <h3 id> <h4 id> <h5 id> <h6 id>
  • Lines and paragraphs break automatically.
  • Web page addresses and email addresses turn into links automatically.
CAPTCHA This question is for testing whether or not you are a human visitor and to prevent automated spam submissions. Image CAPTCHA
Enter the characters shown in the image.

How to Calculate Shrinkage in your shop

POS SOFTWARE


Staying on top of your stock is critical to loss prevention. Hopefully, you have finalised your stocktake so we can calculate your retail shrinkage.

So why not do so now?

This is how you do it in less than four (4) minutes.

1) We need what your computer had for the value of your stock before the stocktake. If your point of sale is up to date, print out a report of your stock valuation before starting the stocktake. If you do not trust the figure in your point of sale software, then you can, or your accountant can give you an estimate. This is the (Perpetual stock value).

2) This comes from your stocktake and is the value of the stock you had after the stocktake. Your point of sale software will have this figure once you enter the stocktake figure in the stock valuation report. (Physically Counted Inventory Value)

3) What are the total sales of your shop less the non-stock items? E.g. if you sell touch gift cards, these are not stock items, so take them off your overall sales figure. Your total report should be able to give you this figure which is your (Sales of stock products)

4) Value of the damaged goods you counted. (Damaged stock value)

Now please do the following calculation.

Shrinkage% = ((Perpetual stock value)-(Physically Counted Inventory Value))/(Sales of stock product) x 100%

A familiar figure here is about 1.4%, but it varies generally between 0.1% and 6%.

Now what you may also want to look at is your damaged goods, these have a different story, and they can be a compelling story to tell too.

Damaged% = (Damaged stock value)/(Sales of stock product) x 100%

Once you get these figures, you will know how bad a problem you face. Now we know what we are looking at in my next post on this subject, I will discuss how to analyse further. To see how we can reduce this problem. It's a tradeoff as your loss prevention strategy must reduce loss without impacting the customer shopping experience.

Add new comment

Restricted HTML

  • Allowed HTML tags: <a href hreflang> <em> <strong> <cite> <blockquote cite> <code> <ul type> <ol start type> <li> <dl> <dt> <dd> <h2 id> <h3 id> <h4 id> <h5 id> <h6 id>
  • Lines and paragraphs break automatically.
  • Web page addresses and email addresses turn into links automatically.
CAPTCHA This question is for testing whether or not you are a human visitor and to prevent automated spam submissions. Image CAPTCHA
Enter the characters shown in the image.

Handling Premium Chocolate consider their Shelf Life

POS SOFTWARE

There is a trend in our market space for our clients to look into premium chocolates.

When handling premium chocolates, you need to consider their shelf-life. Preference should be given, if possible, to these longer shelf-life items. Although many long shelf-life chocolate products are suitable for gifting all year round, many are not.

But if you are serious about this market, you need some shorter shelf-life fresh chocolates. A fundamental problem here is white chocolate. It only has a low shelf-life. The darker, the better.
The biggest problem is that, over time, white stuff appears on the chocolate, which makes them unmarketable.

It's a problem as, unfortunately, these chocolates do not enjoy being refrigerated! Putting them in the drink fridge, which sort of works for mass-produced chocolates, is not a good idea for premium chocolates. If you must, use a wine chiller. 

Ensure your chocolate counter is out of the sun. That it is in a cool, dry area as the moisture ruins the packaging.

Fortunately, checking your premium chocolates, which should be done regularly, is straightforward.


Go to register reports> Stock> Old Stock on hand.

Now pick the department and get a list of when this stock arrived and the quantity you have on hand.  I am sure you will find some are very old; these must go.

Add new comment

Restricted HTML

  • Allowed HTML tags: <a href hreflang> <em> <strong> <cite> <blockquote cite> <code> <ul type> <ol start type> <li> <dl> <dt> <dd> <h2 id> <h3 id> <h4 id> <h5 id> <h6 id>
  • Lines and paragraphs break automatically.
  • Web page addresses and email addresses turn into links automatically.
CAPTCHA This question is for testing whether or not you are a human visitor and to prevent automated spam submissions. Image CAPTCHA
Enter the characters shown in the image.

GMROI: How you Make More Sales

POS SOFTWARE

Regardless of how experienced you are at overseeing stock, there will be times when goods do not move. Some of your goods are sitting on your racks using up cash that should have been used stock that moves.

This is where in retail the  'Gross Margin Return On Investment - GMROI' is used in retail. It tells you exactly how much gross profit you make on each item in your shop over time. It tells you how successful your goods are in turning into cash.

The formula for calculating GMROI:

GMROI = Annual Sales $ / (Average Inventory at cost) x (Gross Margin %)

Say, for example, an item A sales per annum are $54.00 with a margin of 30%. You have generally about 40 that cost $0.2, so your holding cost is $8.

So the GMROI = ($54 = yearly sales)/($8 holding cost) x (30% Gross margin) = 2.0

So you are getting $2.00 for every $1.00 you invested in this item.

Nice figure, but looking at all the goods in the shop, it is a big job to calculate this for every site.

No, it is not, as your POS System can do it automatically.

What we do is give you the figures. This allows you to see where every dollar invested in your stock inventory be at its greatest productive?

This allows you to look at another item, B which has sales per annum are $78 with a margin of 20%. You generally have about 30 that cost $0.21, so your holding cost is $6.30.

So the GMROI of item B = ($78 = yearly sales)/($6.30 holding cost) x (20% Gross margin) = 2.5

So this retailer is getting $2.50 in back for every $1.00 invested in this item.

The retailer would have done better over the past year in pushing item B even though the gross margin was less.

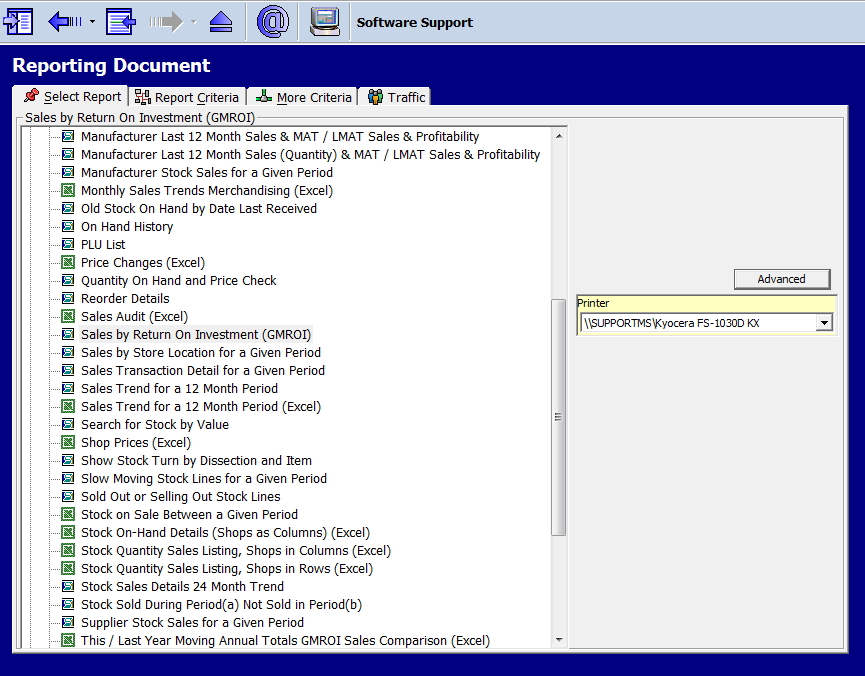
If you go to Register reports, you will see an item "Sales by return on Investment (GMROI)" marked in red here.


Now select an appropriate date range and department to consider. A year is suggested to give the report enough time to provide meaningful figures.

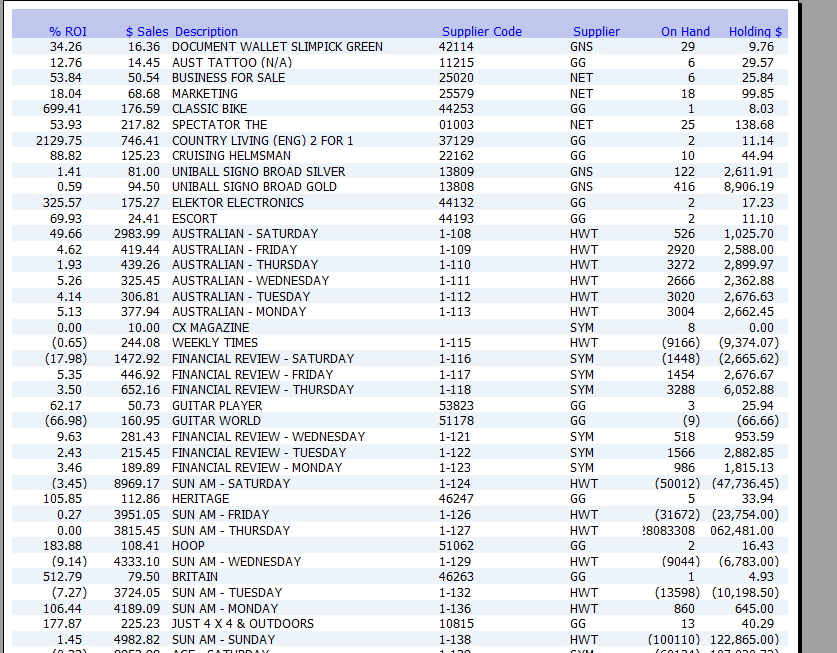
Now I used here five years, to show, in practice use 12 months.

This report can be beneficial.

The green shows the GMROI%.

The red items are the traps, the GMROI is high, but there are few sales.

In Orange, you will see the stock on hand; this is a quick way of verifying that you have enough stock.

The amount it costs you now, the holding costs are displayed in blue.

Altogether, this is an informative report. You will find the summary at the end is loaded with some instrumental figures to examine. Also checkout Diet Coke - High GMROI and low stock holding.

The GMROI recipe is not a magic fix. What it is, is a straightforward computation that assists you with deciding on your stock.

Why are you waiting? Give it a try now?


Add new comment

Restricted HTML

  • Allowed HTML tags: <a href hreflang> <em> <strong> <cite> <blockquote cite> <code> <ul type> <ol start type> <li> <dl> <dt> <dd> <h2 id> <h3 id> <h4 id> <h5 id> <h6 id>
  • Lines and paragraphs break automatically.
  • Web page addresses and email addresses turn into links automatically.
CAPTCHA This question is for testing whether or not you are a human visitor and to prevent automated spam submissions. Image CAPTCHA
Enter the characters shown in the image.

How to use your data to win more sales!

POS SOFTWARE

This is 


Retail Analytics 

Years ago, by looking into their retailers' sales, the music industry found the best policy was to concentrate on their top 40 sales items.  

This is where the action is. 

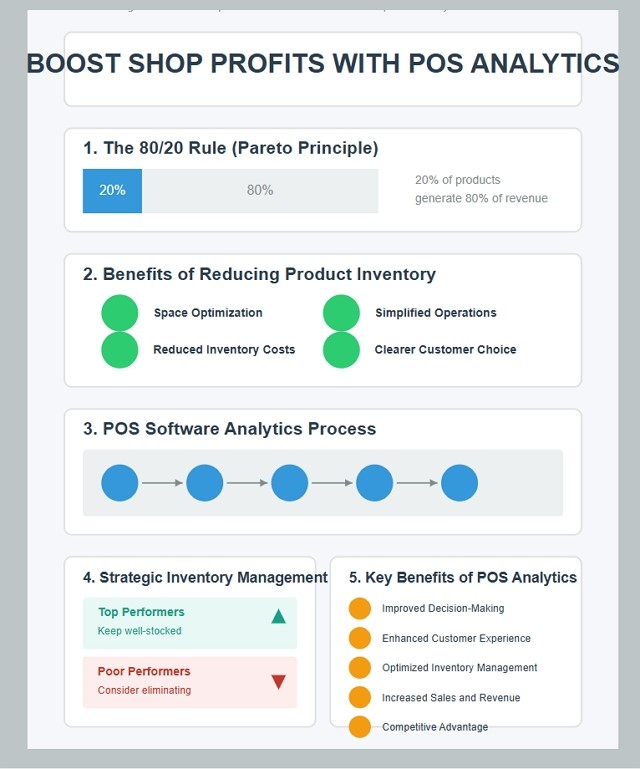
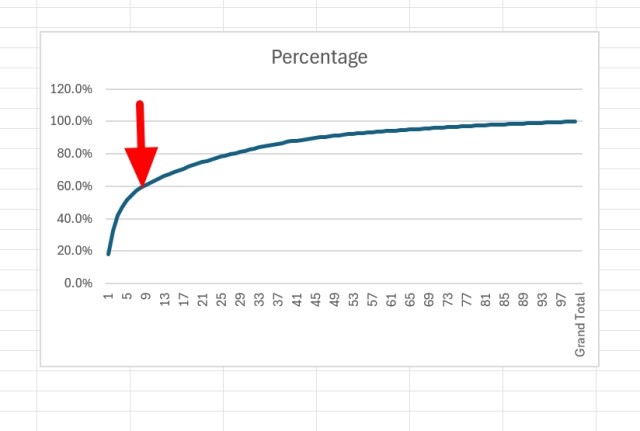
Over the years, when looking at my clients' retail information, this great advice. Here is an example: a client of ours has sold 15181 different items in their shop over the past three years. See, when you look at the sales, once you are about the top 40 items, the sales are getting very close to 0%. There is a lot of profit past the 40th item but few people are coming for those items. 

When I decided to look at the profit that we're making from these 40 items, I found this, 

I do not think that remarkable and almost 25% of the shop's profit came from these 40 items.

As you can see, the profit between items varies, although the basic pattern follows sales. Note the item in negative. Much of the product had to be sold below cost to get rid of it.

What has proven very effective is leaving best-sellers where they are now as they sell well there. Then put some in a best-selling area at the central point of the customer's vision. Some have a few best-selling regions. This is to group products with similar attributes next to each other.

Now how do we find these 40 top best selling items? Well, it's easier than you think.

How to Perform Profit Analysis for Your Retail Business

Go to Register reports.


Now select "Top N Stock Sales for a Given Period."

Now the following comes up.

For example, I will select a day, but you usually would put in a year, now select a department.


Outcomes a report with the top sellers.

Now, you're set!  

Make a few best-selling areas. Now every month, you run this report. Then move a few items to the best-selling areas and take out some.

Add new comment

Restricted HTML

  • Allowed HTML tags: <a href hreflang> <em> <strong> <cite> <blockquote cite> <code> <ul type> <ol start type> <li> <dl> <dt> <dd> <h2 id> <h3 id> <h4 id> <h5 id> <h6 id>
  • Lines and paragraphs break automatically.
  • Web page addresses and email addresses turn into links automatically.
CAPTCHA This question is for testing whether or not you are a human visitor and to prevent automated spam submissions. Image CAPTCHA
Enter the characters shown in the image.