Point of Sale Software

Here are some Articles from the Blog Subject - Inventory -

How to use your data to have better stock control

POS SOFTWARE

Stock trends

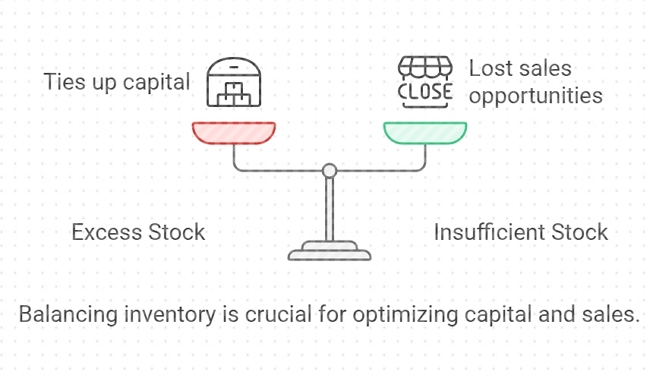
We are all balancing inventory—excess stock ties up capital, while insufficient stock can result in lost sales opportunities.

Balancing inventory levels

Here is a simple key to improving your stock control that is available now, and it will boost your bottom line.

Understanding the Power of Historical Data

Big suppliers don't just guess about stock control—they rely on historical data. They compare monthly sales year over year to identify trends and patterns. They tend to use 24 months of your data, which helps them account for seasonal fluctuations and make more accurate predictions.

But with a modern POS system, you've got all the tools you need to play in the big league.

Why Your POS Data is Gold

Your POS system isn't just for processing transactions, it full of valuable information. Here's why it's better for you than your supplier's information:

Real-time sales data

Unlike your suppliers, who only see what you've ordered, your POS system shows exactly what you've sold.

Seasonal insights

By comparing data from the same months across different years, you can spot seasonal trends specific to your business.

Stock level optimisation

With accurate sales data, you can decide how much stock to hold.

How to Use Your POS Data for Better Stock Control

Let's walk through a practical example of how you can use your POS data to improve your stock control:

Access your sales report

You'll find this under 'Reports'> 'Sales'> 'Stock Sales Details 24 Month Trend'.

Filter your data

For this exercise, we'll keep it simple:

Exclude inactive stock Filter by department or supplier

Look for patterns in your sales data. Are certain items consistently selling well? Do some products have seasonal spikes?

Evaluate stock levels

Compare your current stock levels with your average monthly sales. Do you need to be more overstocked on slow-moving items?

Case Study: Spotting Overstock Issues

Let's look at a couple of examples from our report:

Product A

Average sales: 2 per month Current stock: 6 units Stock cover: 3 months. If you can reorder this product weekly, holding three months of stock might be excessive. Consider reducing your stock levels to free up capital.

Product B

Average sales: 0.5 per month (1 every two months) Current stock: 16 units Stock cover: 32 months (nearly three years!) This is a clear case of overstocking. Unless there's a specific reason for holding so much stock (like a bulk discount or upcoming promotion), you should look at significantly reducing your inventory of this item.

Turning Insights into Action

Now that you've got this knowledge, here are some steps you can take:

Adjust your reorder points

Use your sales data to set more accurate reorder points for each product.

Negotiate with suppliers

Armed with solid data, you can better negotiate order quantities and frequencies with your suppliers. In my experience, most suppliers will listen to you if you have an issue.

Plan for seasonality

If you spot seasonal trends, plan your stock levels accordingly.

Clear out, slow movers.

Identify products that aren't selling well; now you have something to think about and what to do with them.

Focus on your winners

Make sure you're well-stocked with these winners.

The Bottom Line

Leverage your POS data; don't guess. Make informed decisions about your inventory. This approach can help you: Reduce tied-up capital Minimise storage costs Avoid stockouts of popular items With your cash flow

Your POS system is a powerful tool that gives you the information you need to compete.

Our POS software makes it easy to access and analyse sales data.

Contact us to learn how we can help you optimise your stock control and boost your profits.​


Add new comment

Restricted HTML

  • Allowed HTML tags: <a href hreflang> <em> <strong> <cite> <blockquote cite> <code> <ul type> <ol start type> <li> <dl> <dt> <dd> <h2 id> <h3 id> <h4 id> <h5 id> <h6 id>
  • Lines and paragraphs break automatically.
  • Web page addresses and email addresses turn into links automatically.
CAPTCHA This question is for testing whether or not you are a human visitor and to prevent automated spam submissions. Image CAPTCHA
Enter the characters shown in the image.

What sells in my shop during Halloween?

POS SOFTWARE

Kids in Halloween spirit

Once a fringe holiday, Halloween has now become a significant retail event in Australia.

The Rise of Halloween Down Under

Halloween has become a frighteningly big business in Australia. This year, expected

  • A whopping 21% of Australians are expected to celebrate Halloween
  • Total retail sales are forecast to reach $450 million
  • The average Aussie Halloween enthusiast is set to spend $93

Who's Driving the Halloween Craze?

Interestingly, it's not just kids fuelling this trend. Adults aged 35-49 are the most enthusiastic Halloween celebrators, with 40% planning to join the fun—a 3% increase from last year!

Top-Selling Halloween Categories

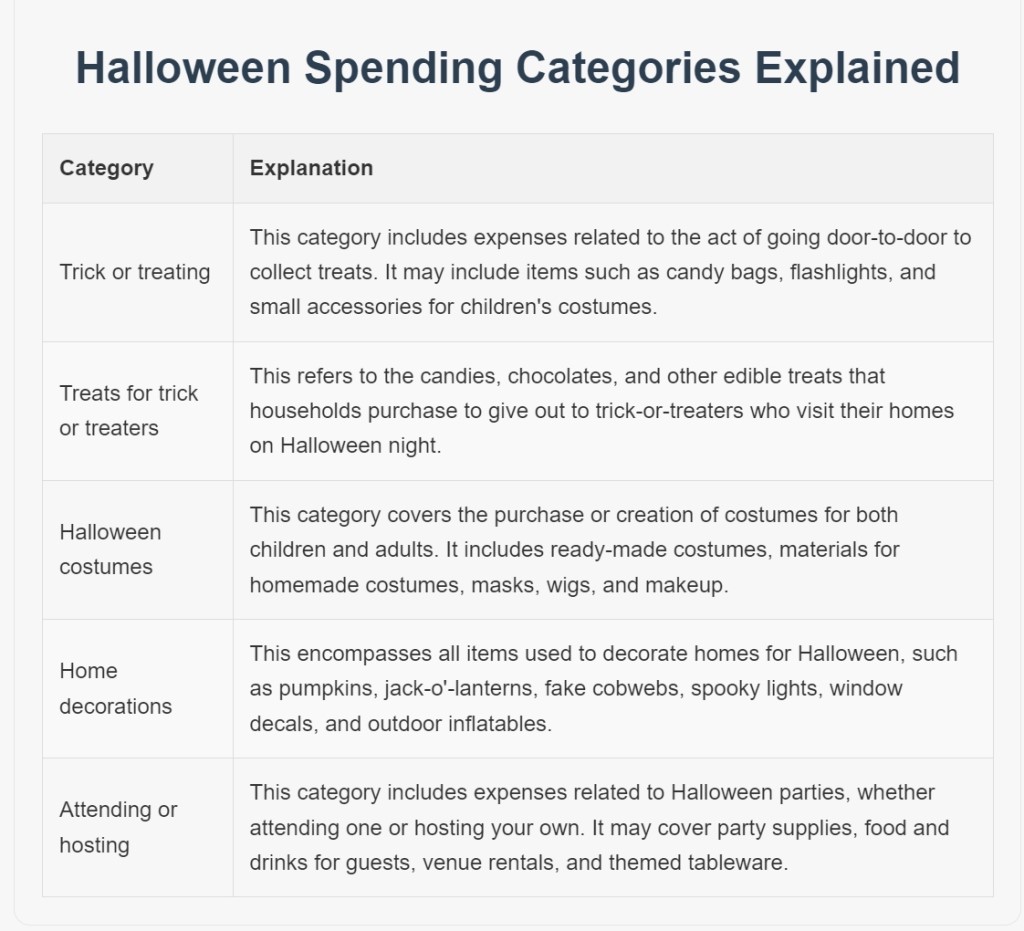
The retail industry expects these categories to sell, so look for top Halloween products here:

Halloween spending categories explained

What sells in your shop

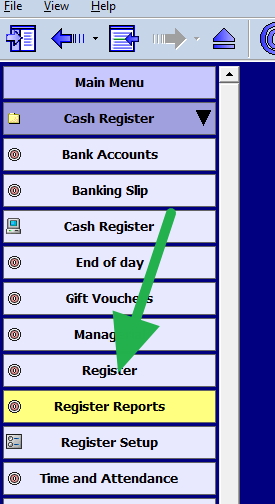
Go to your POS system into Register Reports

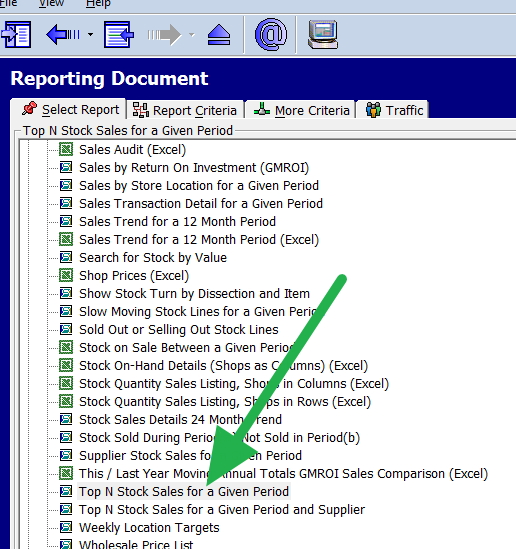
Select "Top N Stock Sales for a Given Period"


In the form, put in the following dates: 25/10/22 to 31/10/22. A report will come out with what is sold over that week. 

As time is running out, could you do it now?

This data-driven approach has helped you avoid overstock nightmares and check that you have the products sold in your shop on Halloween.

Here are some more ideas to consider.

Devilish Decorations

The trend is now that Aussies are getting more creative with their Halloween decor each year, turning their homes into haunted houses.

How about considering:

  • Halloween paper plates, cups, and napkins
  • Spooky banners
  • Balloons
  • Creepy cocktail accessories (skull ice moulds, witch's brew punch)

Trick-or-Treating Essentials

The tradition of trick-or-treating has taken off in Australia, so you may want to consider:

  • Plastic pumpkin buckets for collecting treats
  • Glow sticks and light-up accessories for safety
  • Halloween-themed bags and baskets
  • Face paint and temporary tattoos for quick costume touch-ups

In retailing, Halloween can be challenging. Here is what I've learned over the years:

Start Now

There is a limited amount of time to begin planning your Halloween stock. Look for something original.

Manage Stock Carefully

Many Halloween items have a short shelf life. You do not want to be stuck with difficult-to-sell Halloween-specific items after October 31st. The odds are you have to put them in storage for next year or sell them at a discount.

Put up signs or stands in front of the shop. If you have an Instagram or Facebook page, use it to show your Halloween products and create buzz.

Conclusion: Embracing the Halloween Spirit

Halloween is worth looking into.

FAQs about Halloween in Australia

Q: How big is Halloween in Australia?

A: Halloween is growing in popularity across Australia. Over 5 million Aussies, or about 1 in 5 people, celebrated Halloween this year. Social media and fun family activities fuel interest, so we can expect the numbers to keep rising.

Q: How big are Halloween sales?

A: Halloween spending totaled $430 million in 2022 and jumped to $490 million in 2023. Early estimates for 2024 put spending around $450 million.

Q: How much money do Australians spend on Halloween?

A: Halloween retail trends are up. Today's average spending for a person celebrating Halloween is expected to be $93, an increase of $7 (8.1%) from last year.

Q: What sells the most for Halloween?

A: Halloween sales Australia, top Halloween categories that Australians spend on include:

  1. Trick or treating (45%)
  2. Treats for trick-or-treaters (38%)
  3. Halloween costumes (37%)
  4. Home decorations (32%)
  5. Attending or hosting events (18%)

Q: Which product category has the most sales for Halloween?

A: The top-selling product category is trick-or-treating gear, with 45% planning to buy these supplies.

Q: What age group spends the most money on Halloween?

A: Australians aged 35-49 comprise the biggest spending age group at 40%, followed by those under 35 at 25%.

Q: Is Halloween getting more popular in Australia?

A: Yes. This year, 300,000 more Australians will celebrate than last year, and it is showing steady growth in popularity.


Add new comment

Restricted HTML

  • Allowed HTML tags: <a href hreflang> <em> <strong> <cite> <blockquote cite> <code> <ul type> <ol start type> <li> <dl> <dt> <dd> <h2 id> <h3 id> <h4 id> <h5 id> <h6 id>
  • Lines and paragraphs break automatically.
  • Web page addresses and email addresses turn into links automatically.
CAPTCHA This question is for testing whether or not you are a human visitor and to prevent automated spam submissions. Image CAPTCHA
Enter the characters shown in the image.

More on Economic Ordering Quantity (EOQ)

POS SOFTWARE

Economic Ordering Quantity (EOQ)
Since my last post on Economic Ordering Quantity (EOQ) here, I've got a few questions. Many wanted more details on how to do the calculations for their shop. Since there is interest, I made a comprehensive reply here to explain it fully; that way, I can answer in mass.

Please remember that this requires information from your POS System, some technical skills and access to either Excel or OpenOffice (which are free, by the way).

Why EOQ Matters

Before we dive into the nitty-gritty, let's discuss why EOQ is special. It's a scientific way to manage your business to help you achieve maximum profitability by looking at the real world, where the stock cost goes beyond just the price of an item by the supplier. It addresses how often you should order stock from a supplier (Stock optimisation).

Now, if you buy too much, and it sits on your shelves:

- It then takes up valuable space

- Suffers from shoplifters

- Tying up your overdraft.

etc

Conversely, on the flip side:

- Not buying enough can cost you sales.

EOQ is designed to find the sweet spot between these two problems.

The EOQ Formula

Here's the formula used that mathematicians looking at the problem found:

Number of times to order = SQR(2 x D x k / h)

Where:

  • D is the ordering quantity of the item
  • k is the cost of ordering
  • h is the holding costs

I know our system isn't designed to handle this calculation directly, and the reasons will become clear why not here, but we've got a nifty ad-hoc reporting system that can do it, and it's a great way if you work through this of the power of our Ad-hoc reporting. Trust me, it's worth learning how to use it the Ad-hoc reporting. I think you'll be amazed at the power you have in your Point of Sale Software now.

How to get your EOQ

I never said it would be easy, only that it's a worthwhile exercise.

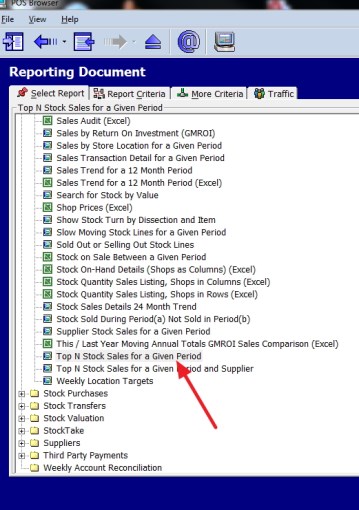
Go to register reports and select the top stock report, which is marked with the red arrow here.

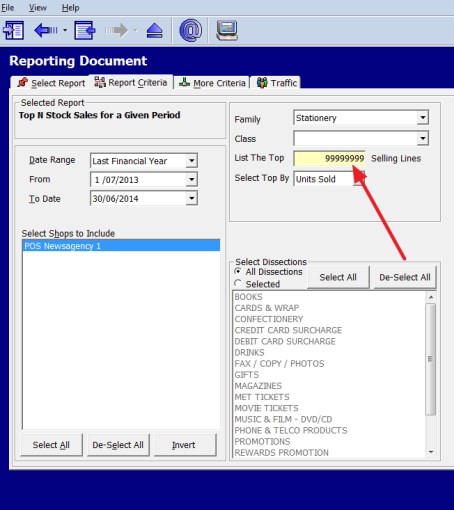
Now, select your criteria; I used the stationery department because it's a simple department that most people could relate to. Furthermore, the note marked in red indicates that I put 99 million in for the number of items needed to get everything. I also picked a whole year, as small periods can have fluctuations that can muck up the long-term trends.

Now I have this report.

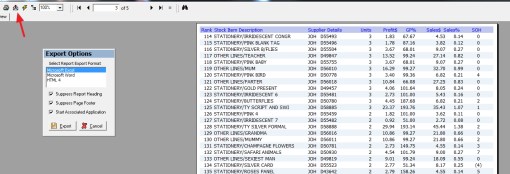
I imported the data into Excel, as shown here with the red arrow.

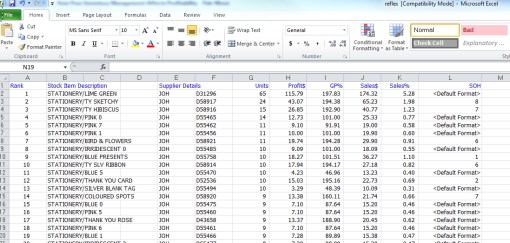
This then produced for me an Excel spreadsheet of my report.

That is the standard report, but now, I can change it to almost anything I want—ad hoc. This is the report I changed it to. Click on it for more details, and I will now explain how I did it.

Stock adhoc report

In my Excel spreadsheet, you will see that I have put all my variables on the right, so I can play with them later.

The first variable I need is D, which is the ordering quantity of the item. I have that here as units, so that problem is solved. All I need to do is divide it by 52 weeks a year, so column M2 =G2/52, and I copy it down.

I have to determine the cost of ordering. It takes the department about two hours for someone to process an order and another hour to process the order when the goods come. Say three hours plus some extras, say about $150. Since I have 247 items in this department, that works out, too.

k = $150/247 = 0.60728745

Now, we need the holding cost (h), which is the holding cost.

I explained how I get my stock-turns here, and it's 10 for this stationery department.

I would say for a year, we are looking at the interest of money plus shoplifting of about 1.5%, so say about 14%, so per week, that works out to 14%/52 weeks a year, about .2%, plus there is a rental on the building. This is something you need to determine. I suggested before that you go to your last year's profit and loss to resolve this. What is the cost of the space that you require to sell an item? When they do this, many report to me how stunned they were just how high that figure is. In this case, as I do not know it, I am setting it to zero.

Now, I need the stock on hand. I could use the figure that is there, but it suffers from the short-term fluctuations I mentioned above, so I prefer to use the yearly figure. I need to subtract the profit from the sales and divide it by the stock turns.

So, I make a formula (Sale$-Profit$)/stock turn in this Excel sheet, which is =(J2-H2)/$R$1, my SOH figure.

My h is now (SOH) x h + Fixed h, and you can see the column there marked N.

Now, my EOQ is easy to determine as it =SQRT(2*M2*$S$2/N2) and copy that down.

Since I am working in weeks, I did that 52 weeks and divided it by my EOQ.

The formula suggests that I should look at it every two or three months, which makes sense as stationery is a small department in this store with sales of about $3000 annually. However, there are certainly more important departments that the shop should investigate.

Now, I would change the figure, increase or decrease the stock turns, the holding costs, etc., to see what happens.

Common Mistakes When Implementing EOQ

Although EOQ is a valuable tool, there are some problems people commonly come up with when trying to use it:

  1. Ignoring variability: It assumes constant demand, which often needs to be corrected, e.g. Xmas stock or Mother's Day stock.
  2. Overlooking many costs: You need to include all the ordering and holding costs, including some less obvious ones like breakage and obsolescence. 
  3. Not updating regularly: As market conditions and costs change, you must periodically review your EOQ calculations; I suggest yearly.
  4. Perishable goods: It assumes that all items do not perish or have a marketing cycle, e.g. A magazine is monthly, and milk cannot be kept.
  5. Forgetting about lead times: It does not account for supplier lead times, particularly for items ordered from the net.
  6. Neglecting order quantity: It assumes you can order as little as you require; some suppliers have minimum orders.
  7. People's natural rhythm: People can be instructed to do the task once a week, every two weeks, or monthly, but it's a bit hard to tell then every 12 days. We do live in a real world.
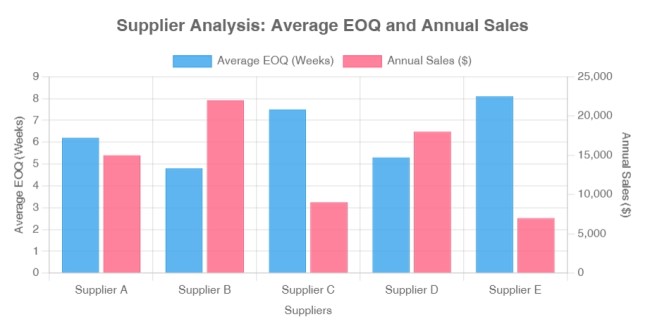
  8. Often shops tend to have to do it by supplier not department: When you start to break down the figures to smaller sections of the shop you get results all over the place.I got this when I looked by suppliers, where you can see the problem.

    EOQ does by suppliers

    I suggest that you keep it simple and do it by department.

Wrapping Up

Remember, good inventory management isn't just about crunching numbers. It's about ensuring profitability is not sacrificed due to poor procedures. This is just one piece of the puzzle.

If there's enough interest, I will do a webinar on this topic and incorporate it into our software. So, let us know what you think!

Did you try to calculate EOQ for your shop? Please tell me what you found. I'm interested in hearing about your experience. Your practical experience is valuable to us, whether you have any questions or just want to share your thoughts.

Frequently Asked Questions (FAQ)

Here is an FAQ to answer some of your questions on the topic

Q1: What is Economic Ordering Quantity (EOQ)? 

A: EOQ is a scientific method used to determine the optimal quantity of inventory to order for the most profit.

Q2: Why is EOQ important for my business? 

A: EOQ helps maximize profitability by finding the sweet spot between overstocking (which ties up capital and space) and understocking (which can lead to lost sales).

Q3: Where can I learn more about implementing EOQ in my business? 

A: Links above were supplied, the Wikipedia has a decent article too here.

Q4: Do I need special software to calculate EOQ? 

A: No. While specialized software can help, you can calculate EOQ using Excel or OpenOffice spreadsheets using your POS System.

Q5: How often should I recalculate my EOQ? 

A: As market conditions and costs change, you should review and update your EOQ calculations. I think yearly should be enough. 

Q6: Can EOQ be used for all types of inventory? 

A: I think even if it is not applicable, the figures it produces, even if you have perishable goods or items with very short marketing cycles, are interesting.

Q7: How does EOQ relate to my Point of Sale (POS) system? 

A: Many modern POS systems are required to provide the information needed for EOQ calculations.

Q8: Is EOQ the only inventory management method I should use? 

A: No, EOQ is one tool among many.

Q9: Is this EOQ the only inventory formula for this use? 

 No, the EOQ formula has many variations, some of which might suit you better. Please let me know if you find one that you think is better.

Webinar on Stock Control and reporting

POS SOFTWARE


Nowadays, we cannot do face to face meetings, so online webinars do all our training.

It does have some advantages, such as being convenient to attend, and participants who come can save a lot of time as there is no travelling. 

Anyway, here is the latest one for those that could not make it.

Click here for a webinar on Stock Controlling reporting from your point of sale software.


Add new comment

Restricted HTML

  • Allowed HTML tags: <a href hreflang> <em> <strong> <cite> <blockquote cite> <code> <ul type> <ol start type> <li> <dl> <dt> <dd> <h2 id> <h3 id> <h4 id> <h5 id> <h6 id>
  • Lines and paragraphs break automatically.
  • Web page addresses and email addresses turn into links automatically.
CAPTCHA This question is for testing whether or not you are a human visitor and to prevent automated spam submissions. Image CAPTCHA
Enter the characters shown in the image.

Save using predictive analytics in your shop
POS SOFTWARE


It is not an exaggeration to say that seeing the future is a gift every business wants, but such superpowers are only in fiction. Still, the predictive technology and analytics in your POS Software will give you a better understanding of future events. 

For example, using your data-driven analytics with its artificial intelligence in your POS system can give you predictions on your ideal stock holding now based on its previous history. This can help you make real-time decision-making, allowing, for example, to overcome the current delivery issues leading to the current shipping delays. 

The problem is that you now have thousands of stock items in your shop. Keeping track of all these stock items is, in practice, unworkable as it is too much work. To reduce the workload, many people try to pick the top-selling items and essentially ignore the rest. It works for the top, say 100 items but leaves the rest out of control. But it is no problem for the computer to control thousands of items. 

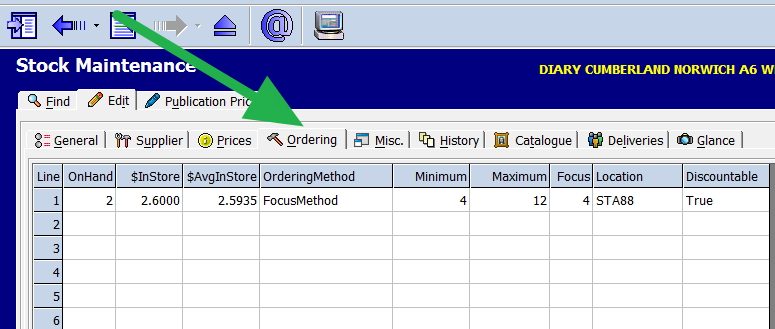
Let me show you an example. See the example of a stock item above in the ordering screen. 

We have here two (2) on hand. The expected sale for this week (focus quantity) is four (4) sales a week. So the computer is saying you need to order ASAP or miss out on sales this week and a few next week until you get it in stock. 

That is one item. You have thousands of stock items in your shop now. Doing this is too much work manually. 

Using it, you can spot early warning signs.

One of my clients recently discovered that he had forgotten about Diya lamps. These surged in sales last month, so okay, he missed some but managed to get much of it. So he got some excellent sales that he would have missed out on without this predictive analytics. 

If you need any help or want to get an automated stock control system going in your shop, please contact us.


Add new comment

Restricted HTML

  • Allowed HTML tags: <a href hreflang> <em> <strong> <cite> <blockquote cite> <code> <ul type> <ol start type> <li> <dl> <dt> <dd> <h2 id> <h3 id> <h4 id> <h5 id> <h6 id>
  • Lines and paragraphs break automatically.
  • Web page addresses and email addresses turn into links automatically.
CAPTCHA This question is for testing whether or not you are a human visitor and to prevent automated spam submissions. Image CAPTCHA
Enter the characters shown in the image.

Our supply chain causing cost problems now

POS SOFTWARE

Today, we are struggling to cope with the impact of pandemics on our supply chain. It has become more than a severe inconvenience that is affecting profitability.

On top of the supply problems, many suppliers struggling with shortages are quietly increasing prices and substituting old formerly unsellable stock. So prices are going up everywhere except in official Treasury figures.

What happened to us lately is interesting. We ordered two items for around $ 18 unit price and with a shipping cost of $15. But what happened was we were charged the two shipping costs of $30 in one parcel. They never did that before.

You must be cautious otherwise, you will not notice the price increase or replacement.

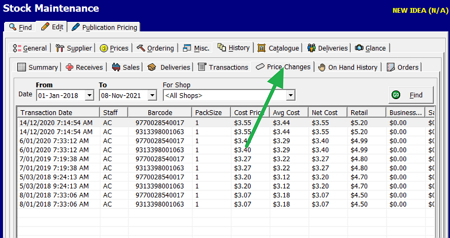
Older legacy systems with inadequate stock tools cannot do this. Here's a valuable screen if you need to check

Stock maintenance> History tab> Price change

What it does is provide a product history for each barcode and price change over time.

It is worth studying as this screen will be invaluable for you over the next few months until we get over this supply crisis.

Add new comment

Restricted HTML

  • Allowed HTML tags: <a href hreflang> <em> <strong> <cite> <blockquote cite> <code> <ul type> <ol start type> <li> <dl> <dt> <dd> <h2 id> <h3 id> <h4 id> <h5 id> <h6 id>
  • Lines and paragraphs break automatically.
  • Web page addresses and email addresses turn into links automatically.
CAPTCHA This question is for testing whether or not you are a human visitor and to prevent automated spam submissions. Image CAPTCHA
Enter the characters shown in the image.

Can you Cancel Sales Due To a Pricing Errors?

POS SOFTWARE

Recently one of my customers got fresh stock. They updated their prices to the new prices. Then they placed under the old shelf price the new stock. A customer appeared with the item and demanded that the shelf price be honoured. What my client did was observe the shelf price. It was a good customer, repeat business etc. Then they removed the shelf price. He did end the problem as the customer came back and wanted more at the old price.

This generated a discussion as happens when a retailer displays the same item at different prices.

This situation is common in retail. If you visit bargain sites, you will find many examples of pricing errors in stores. Often with comments that buyers need to grab the items before the retailer realises the mistake.

Now I am not a lawyer, but this is my understanding.

Most Australian consumer codes state that you must sell your product at a lower price or withdraw it from sale until the price can be corrected. Things will get murky if the product is advertised or you did not make a mistake.

If it is a mistake, you are not obligated to honour the lower price. This is because the sale is considered an offer. So before the deal is done, you must agree with the customer offer to buy. Thus you have the right to explain that you have made a pricing error and reject the customers' offer to buy the item.

What I have noticed is that some majors include in their terms lines like

We reserve the right to cancel an order that we have accepted at any time for any reason.

The best solution is to find the incorrect prices before the customer mentions them. In this, we can help. We have a quick and easy way to check stock prices for what you have on hand.
 

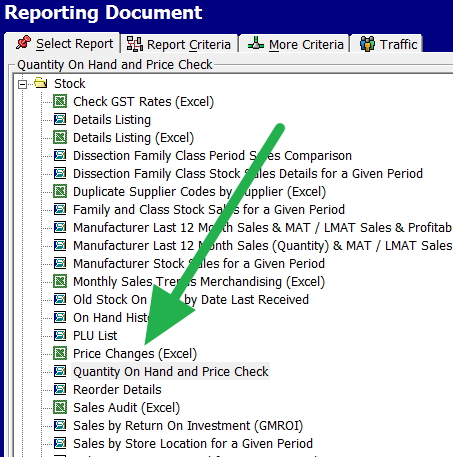
Go to reports. There is an option Quantity On Hand and Price check; click on that.


POS Software menu

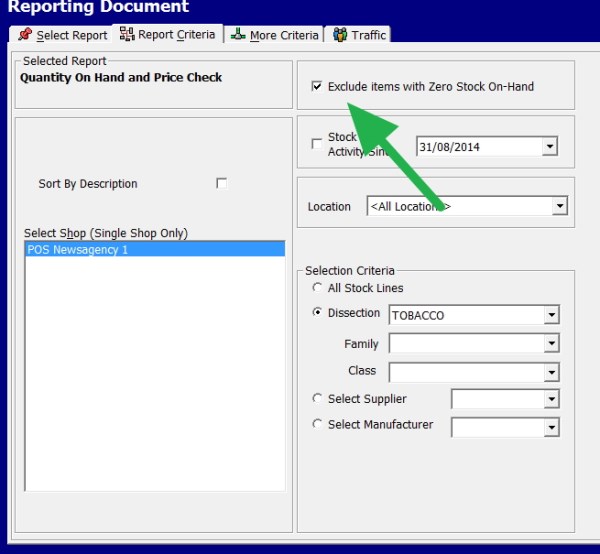
For this exercise, we exclude those items that we do not have in stock. If you are out of stock, there is no problem here. If you do not have accurate stock control, use the line below, stock activity from a selected date.

POS Software On hand and preice options


Now it generates a report that lists the details of your article, including margins.


POS Software On hand and price report

See the margins are listed so you can now check your prices.

I'm sure you will find something. I know one of my clients who reviewed it told me that he found some bugs.


Add new comment

Restricted HTML

  • Allowed HTML tags: <a href hreflang> <em> <strong> <cite> <blockquote cite> <code> <ul type> <ol start type> <li> <dl> <dt> <dd> <h2 id> <h3 id> <h4 id> <h5 id> <h6 id>
  • Lines and paragraphs break automatically.
  • Web page addresses and email addresses turn into links automatically.
CAPTCHA This question is for testing whether or not you are a human visitor and to prevent automated spam submissions. Image CAPTCHA
Enter the characters shown in the image.

Checking your prices match your suppliers price list fast!

POS SOFTWARE

POS Software menu

Many suppliers are starting to issue new price lists. It can be a lot of work to see if your inventory matches the latest price list.


So this is a simple way to do this:

Go to the report

Click Quantity on Hand and Price Check.

Exclude items that are out of stock in this exercise. If you do not have accurate inventory control, you should use the following rule, inventory activity from the selected date.

Then select the appropriate supplier.

You will see a report with items, costs, available quantities, and sales prices. Match it off.

Another example of how our POS Software saves you time.

Add new comment

Restricted HTML

  • Allowed HTML tags: <a href hreflang> <em> <strong> <cite> <blockquote cite> <code> <ul type> <ol start type> <li> <dl> <dt> <dd> <h2 id> <h3 id> <h4 id> <h5 id> <h6 id>
  • Lines and paragraphs break automatically.
  • Web page addresses and email addresses turn into links automatically.
CAPTCHA This question is for testing whether or not you are a human visitor and to prevent automated spam submissions. Image CAPTCHA
Enter the characters shown in the image.

Find slow moving stock in your shop

POS SOFTWARE

This is a step by step discussion on how to investigate your stock for dead and slow-moving stock lines.

What often happens

If a department has many inventory rules, it is expected that 20% will be flagship products, 60% on average, and the rest slow to dead. Without action, 20% ​​of the flagship products get sold. These are often replaced by average products. Soon the department has fewer sellable products. The inventory fills with unsellable products. They take up the space, take up your capital, and, more do not attract customers.


Inventory Planning

This is where inventory planning comes in because you need the products that sell.

Now let's work on the greeting card. This is because there are so many products that cannot be controlled by gut and feel. As a result, consultants can demand thousands of dollars to do what your POS System can do for free using this method.

By the way, this is an actual example of what we did in a client's store.

We decided a baseline for a slow inventory line was one sale every four months. I agree if you think this is too low, but it was the initial decision because the problem was much bigger than expected.

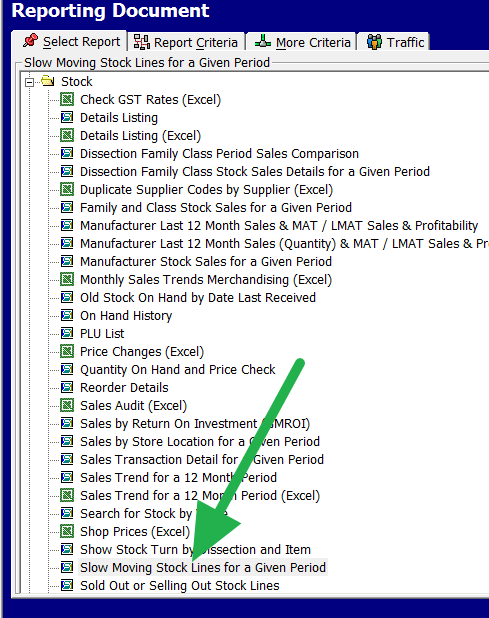
So, go to Reports> Stock> Slow Stocklines. See above.

I would suggest as a first rule use two years, to give you a long-term perspective. So we put in less than six sales, and we had stock. 

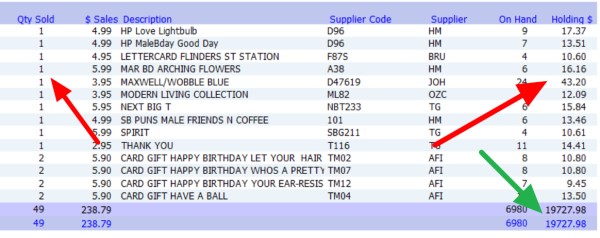
We got a 16-page report which you will find interesting.


As you can see in the green, the total value of these items in stock at this store was almost $ 20,000. That $20,000 is useless for the business.

Let's take a look at the details.

See the red arrows. One item had one sale in two years. Twenty-four are still on the shelves now. The total value tied up here is $43.20. How long do you think it will take to sell these items at this rate? After two years, is it still marketable? Worth investigating, I think.

This is an example of how such inventory analysis can provide information to improve decision making. It can help reduce costs and improve sales.


Try it.

Add new comment

Restricted HTML

  • Allowed HTML tags: <a href hreflang> <em> <strong> <cite> <blockquote cite> <code> <ul type> <ol start type> <li> <dl> <dt> <dd> <h2 id> <h3 id> <h4 id> <h5 id> <h6 id>
  • Lines and paragraphs break automatically.
  • Web page addresses and email addresses turn into links automatically.
CAPTCHA This question is for testing whether or not you are a human visitor and to prevent automated spam submissions. Image CAPTCHA
Enter the characters shown in the image.