This is a step by step discussion on how to investigate your stock for dead and slow-moving stock lines.
What often happens
If a department has many inventory rules, it is expected that 20% will be flagship products, 60% on average, and the rest slow to dead. Without action, 20% of the flagship products get sold. These are often replaced by average products. Soon the department has fewer sellable products. The inventory fills with unsellable products. They take up the space, take up your capital, and, more do not attract customers.
Inventory Planning
This is where inventory planning comes in because you need the products that sell.
Now let's work on the greeting card. This is because there are so many products that cannot be controlled by gut and feel. As a result, consultants can demand thousands of dollars to do what your POS System can do for free using this method.
By the way, this is an actual example of what we did in a client's store.
We decided a baseline for a slow inventory line was one sale every four months. I agree if you think this is too low, but it was the initial decision because the problem was much bigger than expected.
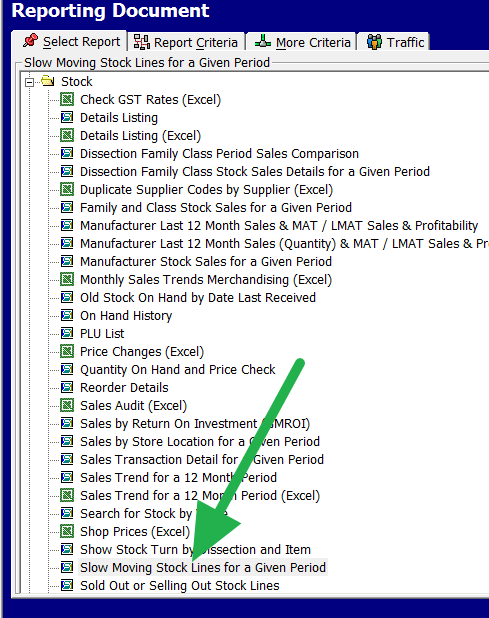
So, go to Reports> Stock> Slow Stocklines. See above.
I would suggest as a first rule use two years, to give you a long-term perspective. So we put in less than six sales, and we had stock.
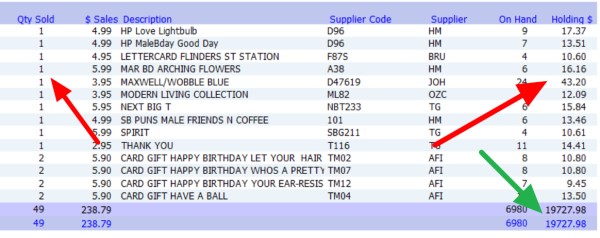
We got a 16-page report which you will find interesting.

As you can see in the green, the total value of these items in stock at this store was almost $ 20,000. That $20,000 is useless for the business.
Let's take a look at the details.
See the red arrows. One item had one sale in two years. Twenty-four are still on the shelves now. The total value tied up here is $43.20. How long do you think it will take to sell these items at this rate? After two years, is it still marketable? Worth investigating, I think.
This is an example of how such inventory analysis can provide information to improve decision making. It can help reduce costs and improve sales.
Try it.


