It is said that "The devil is in the detail."
In retail, its the item that sells not the category or the department!
A supplier rep is coming to see you, no doubt they are a friendly person. They have been briefed, they have an excellent overview of the market for their product, the odds are they know how their stock is moving in your store better then you do and they know your shops potential for their product better than you but they also have an agenda to get you to sell more of their product.
So what you need to be is briefed too and with a point of sale software, you can and should be able to look at this supplier's range in your shop and see exactly to the item level what is selling. How fast their items are selling? Which items are making the money? So you can determine which of their items are worth investing.
Your stock performance report helps to answer such questions.
What I will do here is take you through a review on one such report and what you can learn from this report.
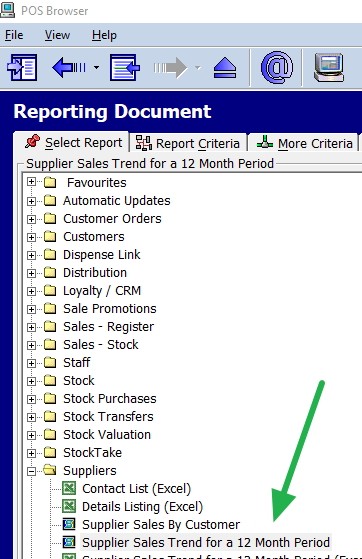
Go to register reports>Suppliers>Suppliers sales trend, see the arrow in green

There are the ad-hoc, excel and OpenOffice import which please ignore for the time being although I do suggest later using it to produce summary reports.
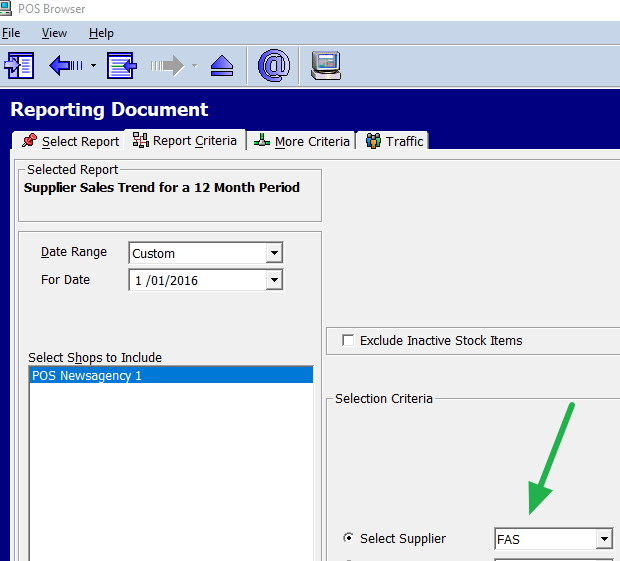
Now the options, I picked are here.

I picked an arbitrary supplier FAS. Again ignore the extra options for now and press view report.

Here’s how it goes:
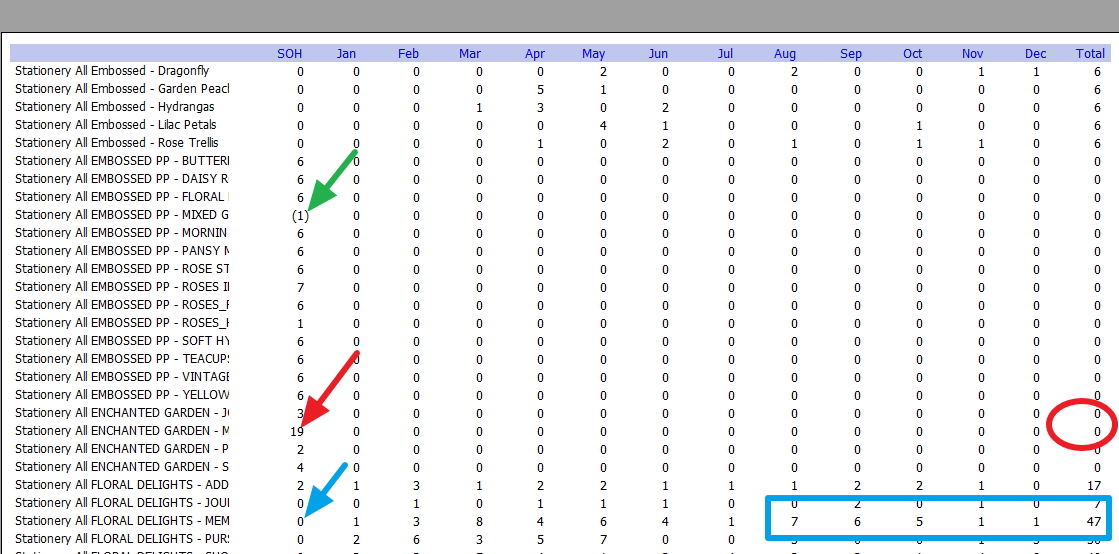
Look at the arrow in red, you have 19 of this item now, but you never sell any of these items. It is a worry.
Conversely look at the item in blue, you have none in the shop, and you have sold heaps of these items, what gives here?
Now in green what you will see is that one of the stock items is in negative. This is not a good sign as it shows your stock quantities are not entirely right.
It all comes down to this
By looking at these items in detail, you can see which items are selling well. You can bring up this with the rep as you now have a clearer idea of what you need and what to order.


