Stock know your 1%
The retail world operates on a fascinating principle that can transform your business strategy: a tiny fraction of your inventory drives most of your success. This insight, known as the 1% Rule, demonstrates why selective focus is crucial for maximising your store's profitability. To get the 80/20 rule, that fact is that most retail slightly less than 1% of the products you handle typically generate 50% of your total revenue. It isn't just theory – a proven pattern that emerges across various retail sectors.
When I first saw this, it hit me like a brick.
I analysed a retail store in Melbourne with over 20,000 stock lines.
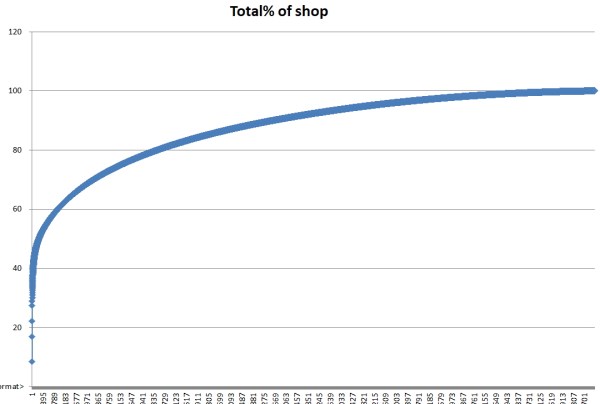
The analysis revealed striking results: just 220 products (about 1%) generated 50% of total sales. Even more remarkable, the top 10 items accounted for 33% of revenue, with the top two products driving 15% of all sales.
Product Performance Analysis
Your POS system is the key to unlocking these valuable insights. Regularly analysing your top-performing products reveals patterns in customer preferences and purchasing behaviours that can guide your retail strategy.
Now, let us find your top 1% stock lines.
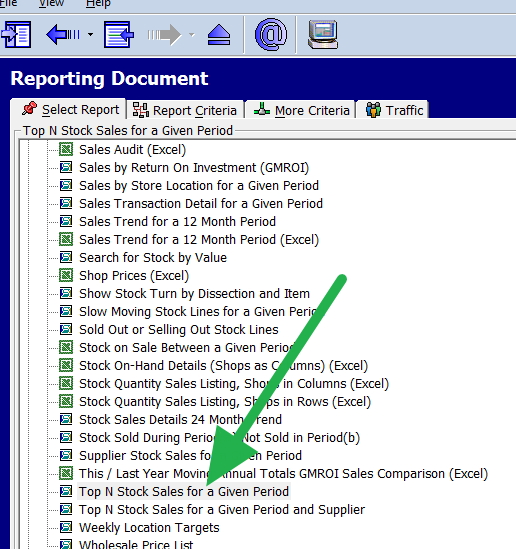
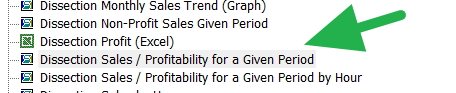
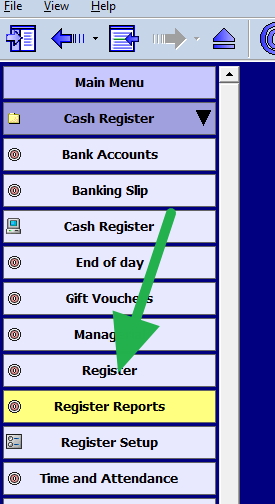
Go to register reports and select the top stock report as marked with the red arrow here.
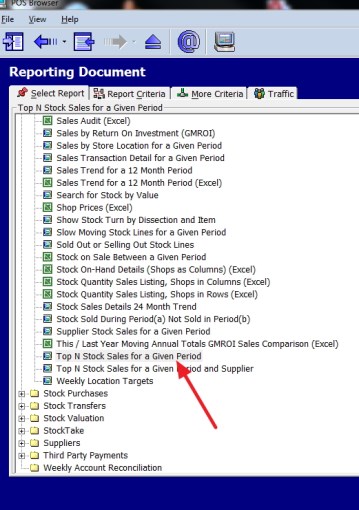
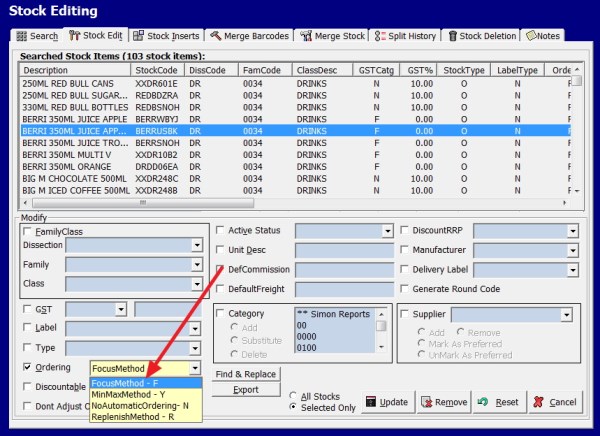
You will get this screen.
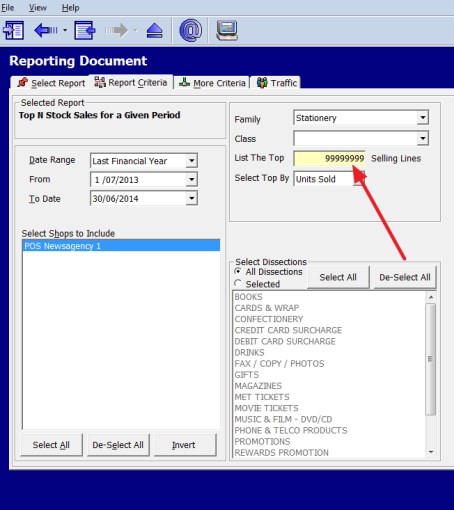
Now select your criteria. Note that there is also a tab called "More Criteria," which has more options, plus the traffic (which is people in the shop) option, but we will discuss that later.
I suggest you do this by looking at overall shop sales and then doing in-depth research for each department.
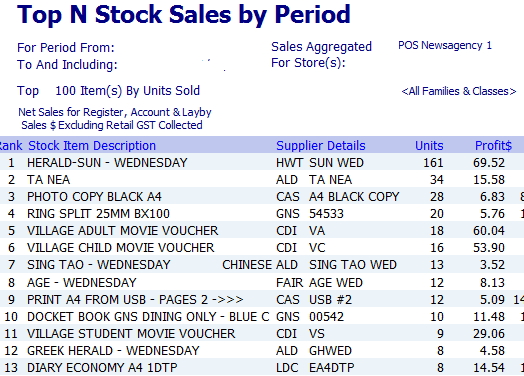
Here, I used the stationery department. In red, I put in 32000 to make sure I got everything. As I like to get a long-term view, I selected a whole year, as small periods can have major fluctuations.
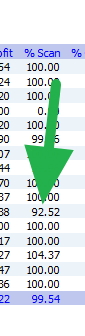
Then you will get a report with all the figures.
It’s that simple
It can be done in less than a minute.
Now you have them what can we do, well...
Stock Management Priorities
- Implement automated reorder points for top sellers
- Monitor stock levels with heightened attention
- Adjust order quantities based on sales velocity
- Create buffer stock for your star products
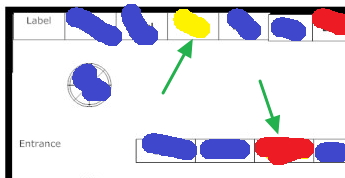
Maximising Visual Impact
Display Excellence
Transform your store layout to showcase your top performers effectively:
- Position best sellers at eye level for maximum visibility
- Create prominent displays that draw attention
- Ensure easy access from multiple angles
- Cross-merchandise with complimentary items
Team Empowerment
Your staff plays a crucial role in maximising the potential of your top performers:
- Share detailed product knowledge
- Provide specific merchandising guidelines
Common Pitfalls to Avoid
Understanding what not to do is just as important as knowing what to do:
Inventory Management Mistakes
- Running out of stock during peak periods
- Failing to maintain adequate safety stock
- Neglecting to analyse seasonal patterns
- Overlooking complementary product opportunities
Analysis Oversights
- Assuming past performance guarantees future success
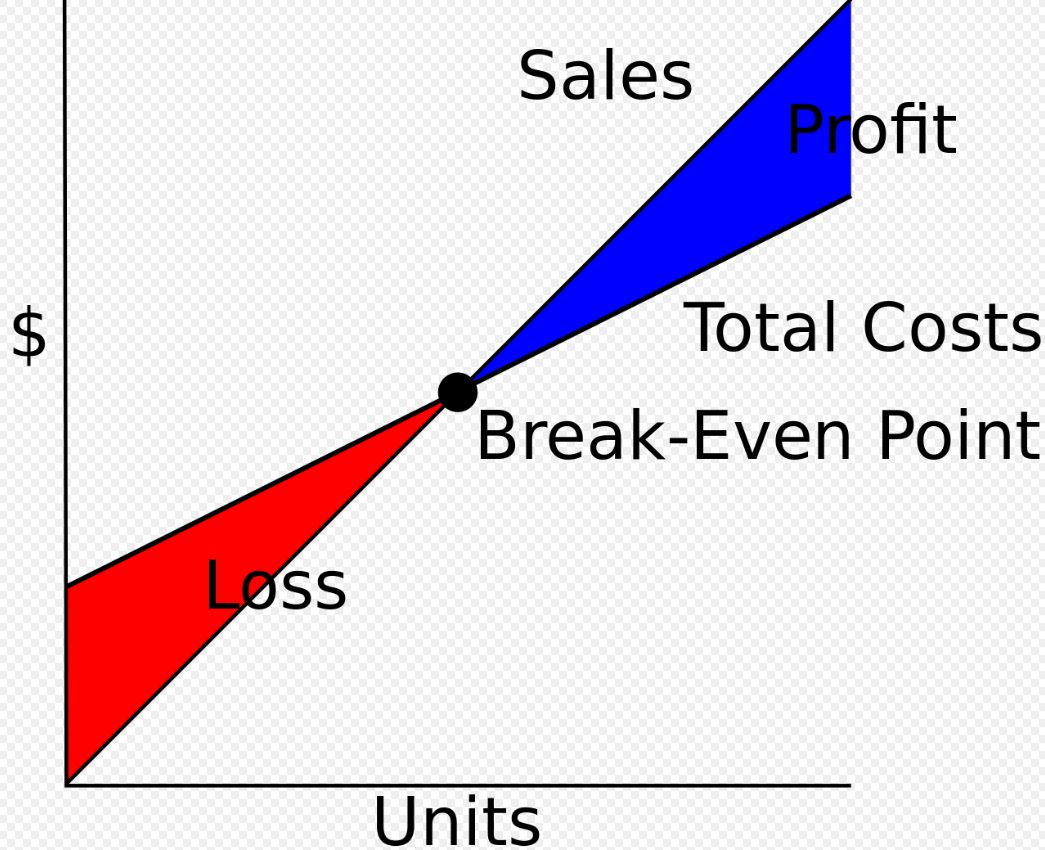
- Focusing solely on revenue without considering profit margins
- Neglecting to analyse why products perform well
- Missing opportunities for product bundle creation
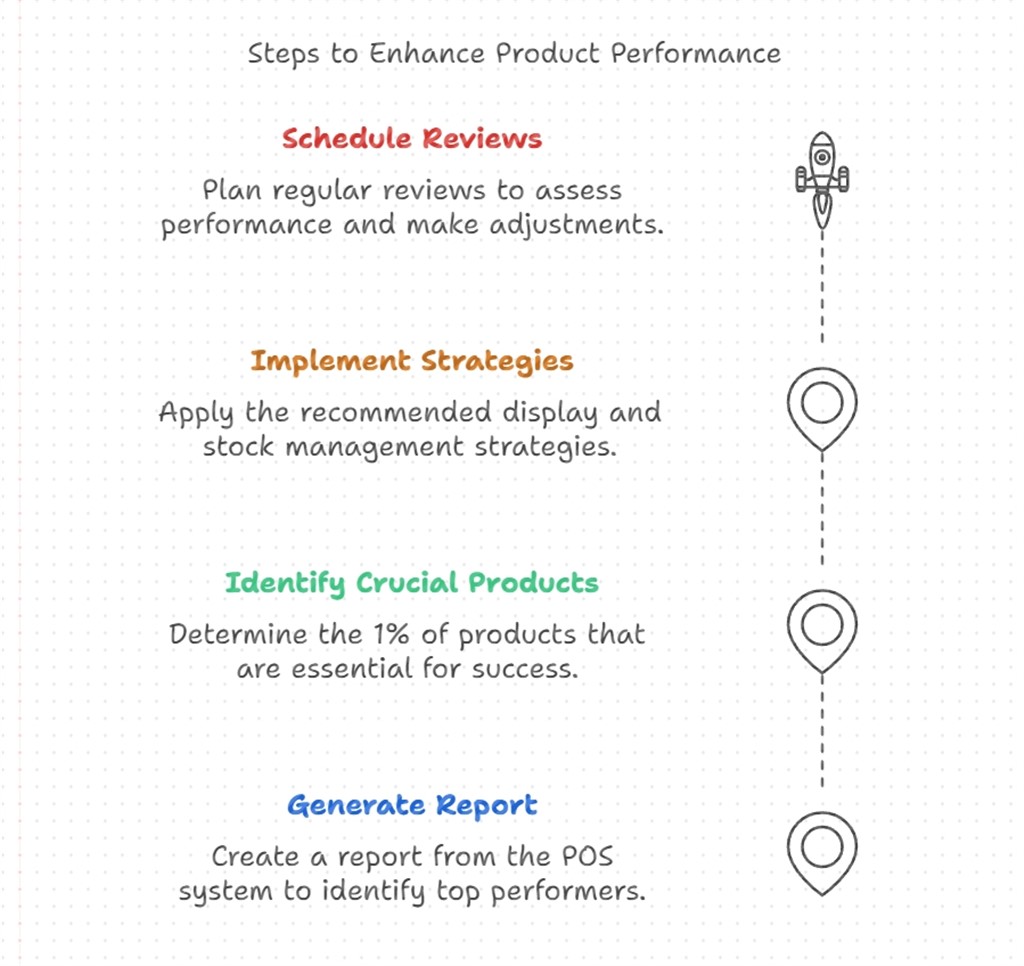
Implementation Strategy
To harness the power of the 1% Rule effectively:
Taking Action
Transform your retail success today:
Conclusion
Remember, retail success isn't about managing everything equally—it's about focusing your efforts where they matter most. By understanding and applying the 1% Rule, you're managing your store and optimising it for maximum profitability. The data is already in your POS system and waiting for your use. The only question is: Are you ready to use it?
Frequently Asked Questions
Q: How often should I update my top performer's analysis?
A: It only takes a minute to run. Consider making it a monthly review. A regular review helps you spot trends early and adjust your strategy accordingly.
Q: What if my top performers change frequently?
A: Fluctuating top performers often indicate seasonal trends or changing customer preferences. Use your POS system's historical data to identify patterns and plan inventory accordingly. This variability makes regular monitoring even more crucial for maintaining optimal stock levels.
Q: Should I focus only on revenue when identifying top performers?
A: While revenue is essential, consider using profit and sales numbers. High-revenue items often have low margins.
Q: How can I prevent stock-outs of my top performers?
A: Implement these proven strategies:
- Set automated reorder points in your POS system
- Calculate safety stock levels based on lead times
- Monitor daily sales velocity
- Establish supplier backup plans
Q: What's the best way to merchandise top performers?
A: Create a dynamic merchandising strategy that includes:
- Prime positioning at eye level
- Multiple display locations throughout the store
- Cross-merchandising with complimentary items
- Clear, professional signage highlighting key features

 It is easy to set up and use for details. Please, click here