
What is much easier and quicker for retailers than sifting through a POS report to understand their data is looking at a simple visual screen. Here I will show you how to convert a standard PosBrowser report into a simple AI-generated dashboard. It is not only easier to review but also to share with others.
And it only takes minutes to do.
What Is a PosBrowser AI Dashboard?
A PosBrowser AI dashboard is a visual summary generated from an exported report that automatically turns raw figures into charts and graphs and highlights them.
Here is the basic process.
- Run your usual report in PosBrowser and save it as a PDF. Remember the name you saved the report under.
- Click on meta.ai.
- Please type the + in the box and upload your PDF into an AI assistant.
- Now ask the AI to produce a dashboard that shows the exact metrics you want, for example, if I printed out a report on stock sales by category, I might ask for a dashboard that shows the exact measures you need.
Create a stock valuation dashboard by department, top 20 categories, ageing stock, and sales trends over time.
Note: For this example, I specifically used Meta AI because it is currently free. Since most of my clients do not have paid AI accounts, I wanted to select a tool that is highly accessible to everyone. While you can use other AI platforms, Meta AI is a great starting point if you want to test this process without any extra cost.
How Do You Check an AI Dashboard Against the Original PosBrowser Report?
The AI can turn a text-heavy report into a cleaner visual summary within seconds or minutes, depending on the platform and file size. However, you must review the visual output against the original report before sharing it with staff or using it for decisions. AI does make mistakes.
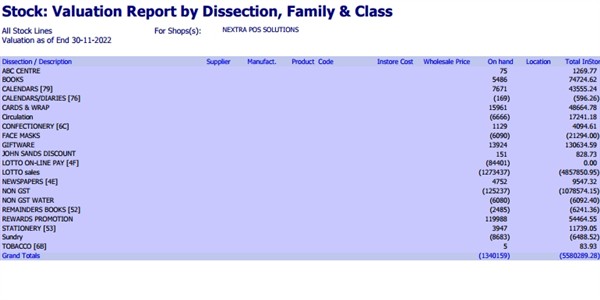
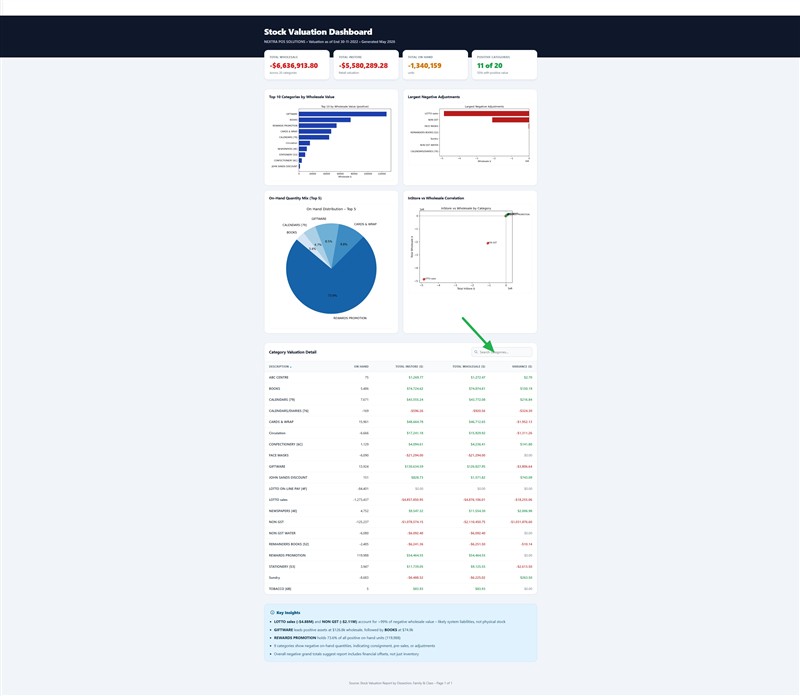
Below, you can see a sample stock valuation report beside the dashboard generated from the same data. The example below shows how a standard POS report became an AI dashboard.The green arrow is where you can add departments to examine.
How to Proceed
I suggest starting off with a few reports you know well, such as a total report. Test how it goes and use this example to improve your requests.
Enjoy.
Written by:

Bernard Zimmermann is the founding director of POS Solutions, a leading point-of-sale system company with 45 years of industry experience, now retired and seeking new opportunities. He consults with various organisations, from small businesses to large retailers and government institutions. Bernard is passionate about helping companies optimise their operations through innovative POS technology and enabling seamless customer experiences through effective software solutions.