Point of Sale Software

Here are some Articles from the Blog Subject - retail space -

How to maximize Your shop's space

POS SOFTWARE

The better store space you have can drive sales and profits. A floor plan helps you look at your space from a new perspective. It lets you see how well your space works. We can study some key facts about your space. These facts show how well your space is used. Let's learn how to find these key facts, and then we can decide how to improve your space.

Why Space Performance KPIs Matter

You are paying for this space, so you must use it wisely. 

A floor plan helps you analyze your store's space and make wise choices. Let's explore how to calculate and understand these space indicators. This way, you can use data to grow your business.
You pay for your store space and want to use it well. Space indicators show how you use your shelves and areas. You see which spots work best by measuring sales or profit per shelf meter. This data lets you decide where to place products and manage stock. Better use of space leads to higher sales and happy customers.

Planograms

These are fundamental tools in retail today. They serve as detailed blueprints for arranging merchandise in a shop. They are visual representations that detail where and how retailers should place products on retail shelves or displays. 

There are a few critical elements to a planogram:

Shelf space allocation - Determining how much shelf space each product receives based on sales data to give high-demand products prominence.

Customer flow - Understanding how customers navigate and move through the store layout.  

Visual appeal - Creating attractive, balanced displays and colour schemes to improve the shopping environment.

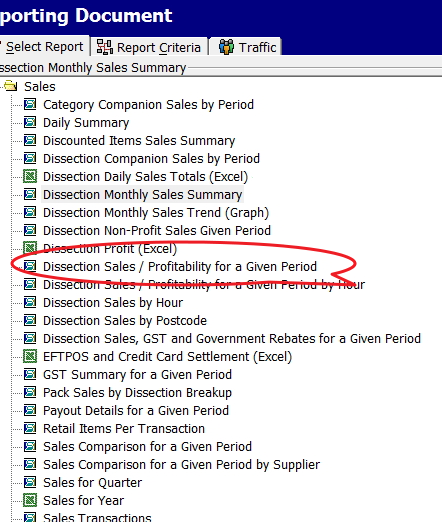
Step-by-Step Guide to Calculating Space Performance

Follow these straightforward steps to calculate your space performance KPIs:

Measure Your Shelf Space:

Start by accurately measuring your store's linear metres of shelf space. I prefer using a tape measure, but pacing out the distance works.

Create a Detailed Store Layout:

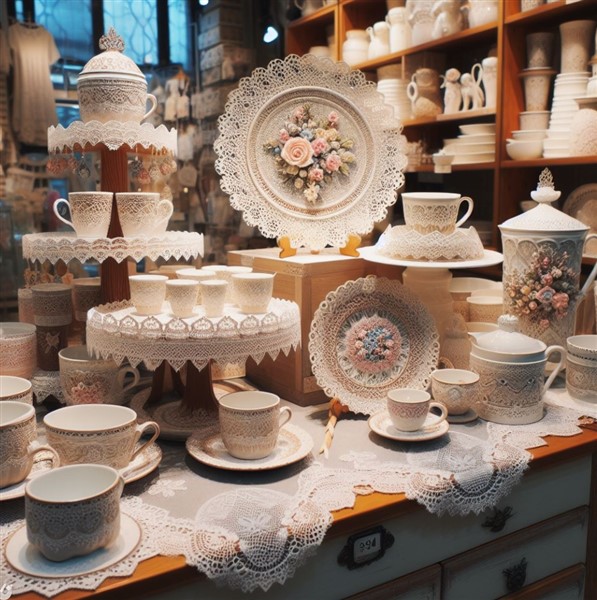
We call this a planogram, and a typical one looks like this:

Store plan

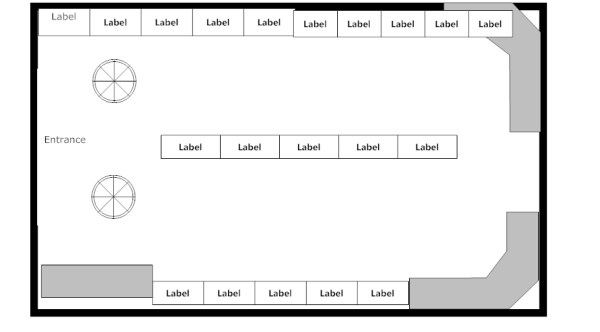
Create a precise drawing of your store using a large sheet of paper or cardboard. I find it helpful if it is lined. Include key areas like shelves, departments, and product sections. This visual guide will make it easier to examine your significant numbers later. In practice, I need to make a few attempts, so I do it once or twice with paper and only then use cardboard. I then recommend photocopying that sheet and working on the photocopy. Then, you can quickly make a new planogram when required, as it has many uses, which I have already discussed here.

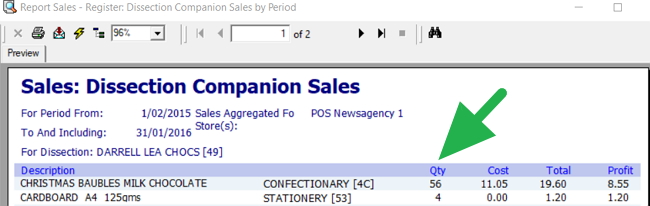
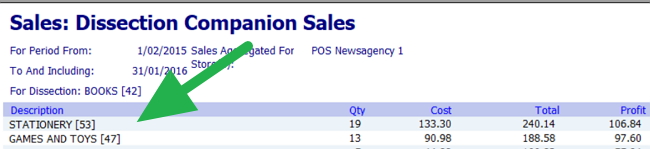
Gather Sales or Profit Data:

Now go to your point of sale system and get sales figures. Instead of using sales, I recommend using the number of sales and profit. So, I tend to use profit here because I think it's the most meaningful, but many prefer numbers. 

Sales breakdown report

Divide Sales/Profit by Linear Metres:

I prefer to use Excel for calculations, but many use calculators.

Divide the total numbers by the overall linear metres you have to give you an average. This will be your baseline.

Now divide the sales, number, or profit by the linear measurement. For example, if you had a $3,300 profit in that period and the shelf you paced is three steps, then your KPI = 1,100. Now go through each department and calculate the figures.

Categories Performance:

  • Blue: Very good
  • Green: Above average
  • Yellow: Average
  • Orange: Below average
  • Red: Poor

Now, we divide the results into five groups. I find it quicker to take the top items as they stand out and put them in my blue group, and then I dump the bad ones in the red. Now you are looking at the rest for every three yellows, a green and an orange. 

Visualise Results on Your Store Layout:

Use colour coding to mark the performance categories on your store layout drawing. This visual representation will help you quickly identify areas performing well and those needing attention.

Interpreting and Acting on Your Space Performance KPIs

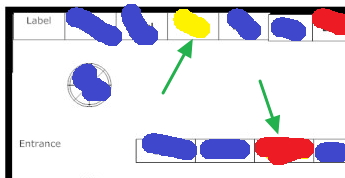
See where the green arrow points. Apparently, there is something to investigate at these spots. See the green arrow pointing to red. This is a problem. Everything around is blue, so it is not the location. As this simple example shows, this KPI is a good indicator of how effective your use of space has been. You can use this to make stock, marketing, and layout decisions.

Although I have used profit here, try the same thing with numbers. What you want with numbers is to see that your clients are attracted to going deep into the shop.

  1. Identify Underperforming Areas: Look for sections marked in orange or red on your store layout. These areas may require changes in product placement, merchandising strategies, or promotional efforts to boost performance. Often, the suggestion here is to reduce the spot size.

  2. Analyse High-Performing Areas: Examine the blue and green sections to understand what is driving their success. Consider increasing the spot for the points marked in blue.

  3. Monitor Customer Flow: Pay close attention to areas where customers seem to be drawn in deeper or where they tend to linger. This technique can assist you in enhancing product arrangement and layout to encourage more browsing and impulsive buying.

  4. Adjust Stock Levels: Use this KPI information to adjust stock levels for various products or categories, ensuring you have the appropriate inventory in suitable locations. Increase the spot size for high-performing items and decrease it for underperforming items.

  5. Implement Strategic Promotions: Use your KPI data to check the underperforming areas. Alternatively, you may consider replacing underperforming items with other stock that sells better in those areas.

  6. Regularly Review and Adjust: Measuring and analyzing space performance KPIs should be ongoing. Review it regularly to maintain an optimized and profitable store layout.

Continuous Improvement and Customer Satisfaction

As discussed, measuring and analysing space performance KPIs is a continuous process. Regularly reviewing and adjusting your store layout and product placement based on your data ensures that your store is continually optimised for maximum sales and customer satisfaction.

The reality is that facts should have the final say, not your gut feeling.

Start now to maximize your store's potential. It takes about half an hour, and you will have much to consider. So start measuring your space performance KPIs today.

Add new comment

Restricted HTML

  • Allowed HTML tags: <a href hreflang> <em> <strong> <cite> <blockquote cite> <code> <ul type> <ol start type> <li> <dl> <dt> <dd> <h2 id> <h3 id> <h4 id> <h5 id> <h6 id>
  • Lines and paragraphs break automatically.
  • Web page addresses and email addresses turn into links automatically.
CAPTCHA This question is for testing whether or not you are a human visitor and to prevent automated spam submissions. Image CAPTCHA
Enter the characters shown in the image.

Allocate space based on stock performance

POS SOFTWARE

Visual representation of a well-organized retail store layout, highlighting prime locations for top-selling products.

Making the most of your space is essential to operating a successful store. You are losing money on valuable real estate on goods that do not sell but take up valuable space in your store.

Which goods ought to have the best placements on your shelves? You are losing money on valuable real estate that takes up every square inch of your store. Which goods ought to have the best placements on your shelves? Should you dedicate more space to that new item, or is it a flop waiting to happen? Savvy retailers know that data is the answer! By leveraging your point-of-sale (POS) software, you can turn sales numbers into better display decisions, maximizing your sales and profitability, so allocate space based on your stock performance.

Identifying Top-Sellers with Your POS Software

Determine which of your products are your greatest sellers—the things that people adore and keep coming back for—before you can optimize your store layout. Your POS system tracks every sale so that it can pinpoint these superstars quickly. Follow these simple steps:

Select register reports

Top Stock report

Now select Top N stock sales for a given period

Top Stock report menu

Try a month or even a whole season to get the best picture of your top-performing products.

Your report will provide a comprehensive list of top-selling items ranked by sales volume or revenue generated. This data lets you decide which products deserve prime real estate in your store.

Optimizing Top-Seller Store Layout

Your top-sellers report shows which products bring in the most money for your company, much like a treasure map. These are the products that should be in the best places in your shop. When distributing space depending on stock performance, keep the following in mind:

Easy Access

Can customers find and reach your best-sellers without a struggle? Put your best-selling items in the places of your business that are easiest to see and reach, like the front, end caps, or eye-level shelves.
 

Displays That Captivate the Eye

Display these goods to get your consumers' attention. Invest in eye-catching displays and merchandising to highlight your best-selling items and promote impulsive purchases.

Sufficient Stock Levels

Is there enough room for all your consumers would like to buy? Based on how well each product sells, allot floor or shelf space proportionately, giving your best-selling products more space and your slower-moving items less.

Pro Tip: Don't be scared to try new things! Try relocating a best-seller if its present location isn't working out well for it. Consider how much of a difference it makes.

Benefits of Allocating Space Based on Stock Performance

By allocating space based on stock performance, you can enjoy numerous benefits:

Increased Sales

Top-selling items should be prominently displayed to entice clients to make larger purchases and increase income for your company.

Enhanced Contentment with Clients

Making sure consumers can quickly locate and obtain the things they want improves the shopping experience and encourages repeat business.

Enhanced Store Appearance

Attractive displays and strategic placement of top-sellers create a visually appealing, organized store environment that invites exploration and browsing.

Better Inventory Management

Allocating space proportionally based on sales performance helps minimize clutter and excess inventory of slow-moving items, streamlining your stock management.

Continuous Monitoring and Adjustments

Remembering consumer preferences and buying patterns can shift over time is important. Therefore, it's crucial to review your sales data regularly and adjust your store layout accordingly. Set reminders to periodically reevaluate your top-selling products and adapt your space allocation as needed. This continuous monitoring and optimization will ensure your store remains responsive to your customers' evolving needs and preferences.

The facts do not lie.

Allocating space based on stock performance is a simple yet effective strategy for small retailers to maximize sales and growth. Using your POS software to identify top-sellers and optimise store layout can create a more engaging, customer-friendly shopping experience that drives business success. Embrace data-driven decision-making, and watch your sales soar as you make the most of your precious retail space.

Use space to maximize Your Shop's profits

POS SOFTWARE

Running a shop can be a problem if you don't have much room.  This is a common problem as most of us have more stock than we can display. Don't let that hold you back! You can turn your shop into a sales machine by understanding your customers and applying clever design tricks.

Why Your Store Layout Matters

A well-designed store does more than look good. It caters to your target customers' needs, guides them effortlessly through your space, and highlights your best products. When customers feel comfortable and understood, they're more likely to find what they need, linger longer, and buy more!

Know Your Audience: The Key to Smart Layout Decisions

Before rearranging shelves, take time to understand your ideal customers. 

  • Demographics: What's the age range, gender, and general lifestyle of your target shoppers? Guys are generally taller than women so that the items can be higher for them; for kids, the stuff must be right down low.
  • Shopping Habits: Do they prefer browsing leisurely, or are they in-and-out shoppers? If they want speed, you need the items at the counter so they can come in, do the sale quickly and leave quickly. Also, do they tend to come in alone or with others?
  • Pain Points: What problems do your products or services solve for them?

Your Secret Weapon: Your POS Data (and a Little Observation)

Your POS System can do much more than just be a simple cash register. It's full of clues about your customers and what they like to buy. 

Here's how you can use this data and watch what happens in your store to make smarter choices on how to arrange things:

Identifying Your Powerhouse Products

  • Best Sellers Report: This tells you precisely what's performing well. Place these top performers front and centre for maximum visibility. 

Go to the top N stock report, which you can find in the Register reports.

report highlighting best-selling items

We then put in a period, say the last two months; this will show you what is selling now, then when you have your list of best sellers nicely ordered by quantity, profit and sales.

Pay attention to the colors and sizes.

Think about using lights and signs to make them stand out more.

  • Companion Sales Report: This report unveils items that are frequently purchased together. Placing them strategically throughout your store can boost sales. Think of how grocery stores place snacks near the drinks section.

Go to Sales-Register > Dissection Companion Sales by Period.

Try looking for an abnormally high number of products for other stuff that sells well with that department. It is beneficial as it can help you select a product to display prominently near a department. This is a well-known method of increasing incremental sales that all majors use.

You take items that sell well with the products of another department and place some of them in that other department's area. There is nothing wrong with a good seller having a few spots in the shop. 

Like this one, a stand of good sellers in a prominent position is always good.


Giftshop stand

Retail analytics of inventory that sells with other items

As you can see here (green arrow), quite a few extra sales could be made by moving some other companies' chocolates close to Darrel Lea Chocolates. Darrel Lea may not like it, but ....

Another great use is more long-term. If grouped by department, you can get a feel of where you should position the display for the department. As you can see here by the green arrow, the books should be close to the stationery.

Report of best selling items

If people looking at your book can see your stationery, you may be able to make a few extra sales. 

These KPIs can give you ideas into which products to display prominently.

Traffic Patterns

Don't discount the insights you can gain by observing how customers move through your store. Are there areas that seem to get ignored? Do people get bottlenecked in a particular spot?  Are there areas that let the customer go too quickly? Use this information to fine-tune your layout.

Data-Driven Merchandising Strategies

Here are some practical ways to apply these insights:

  • Highlight Bestsellers: Your top-selling items deserve prime real estate. Give them prominent shelf space, consider eye-catching displays, and enhance visibility with strategic lighting and signage.
  • Promote Companion Products: Place items often bought together within easy reach.
  • Seasonal Shifts: Adapt your layout based on historical sales data.
  • Clearance Corner or Dump Bin: Designate a small "dump bin" area for heavily discounted items.  This is an excellent way of getting rid of dead stock.

More Tips for a Small-Space-Friendly Layout

  • Embrace Vertical Storage: Use shelves, hooks, and racks to reach upwards.
  • Let There Be Light: Good lighting makes your store inviting and highlights merchandise.
  • Keep it Tidy: A well-organized shop feels bigger.
  • Create an Illusion of more space: Light colours generally make a room feel bigger.
  • Get Creative with Signage: Clear signage to advertise your products.

Case Study

  • The Bookshop Upgrade: We had a client who sold books. He knew his customers loved to browse, so he arranged the bookshelves to create small, inviting nooks. He then put in a couple of comfortable chairs. This encouraged shoppers to linger and discover new titles.

Remember: It's an Ongoing Process

Trends change, and your customers' tastes evolve. Stay flexible, and don't be afraid to experiment!

The Bottom Line

By understanding your customers, using your data effectively, and getting a little creative, you'll create a retail environment that's welcoming, efficient, and drives sales – regardless of your square footage!

Add new comment

Restricted HTML

  • Allowed HTML tags: <a href hreflang> <em> <strong> <cite> <blockquote cite> <code> <ul type> <ol start type> <li> <dl> <dt> <dd> <h2 id> <h3 id> <h4 id> <h5 id> <h6 id>
  • Lines and paragraphs break automatically.
  • Web page addresses and email addresses turn into links automatically.
CAPTCHA This question is for testing whether or not you are a human visitor and to prevent automated spam submissions. Image CAPTCHA
Enter the characters shown in the image.