How is your business going?
Get Quick Business Insights from Your POS System
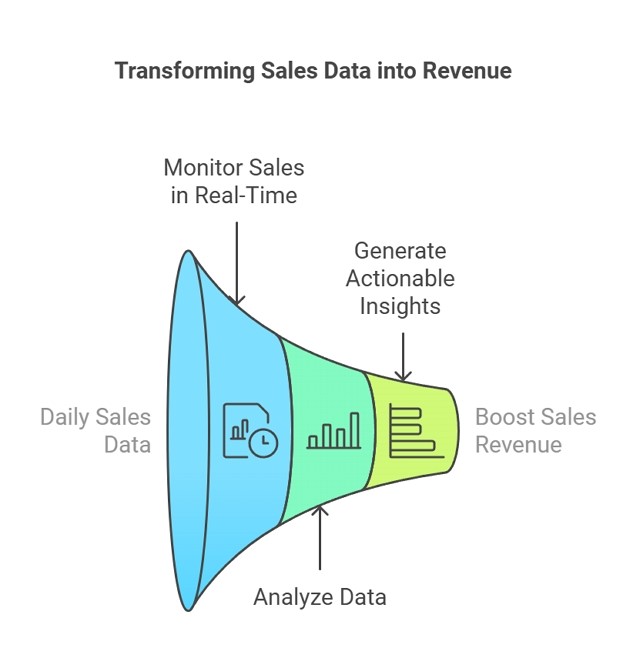
How is your business going? As an SMB owner, have you wondered, "How are we really doing?" You want quick answers without having to dig into receipts or make guesses. Your POS system holds this info. Using POS sales reports, you get instant insights and can track performance. This guide shows you how to capture a business snapshot quickly.
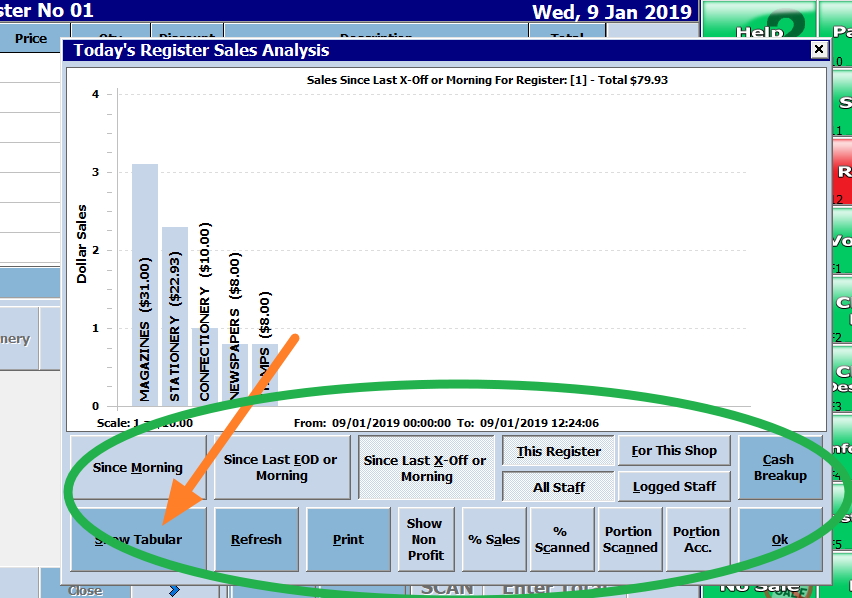
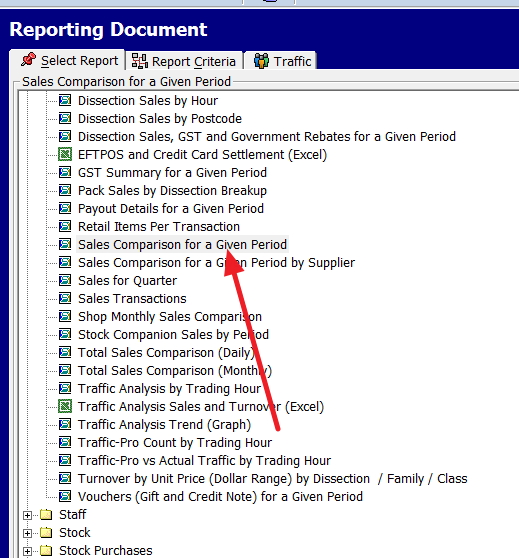
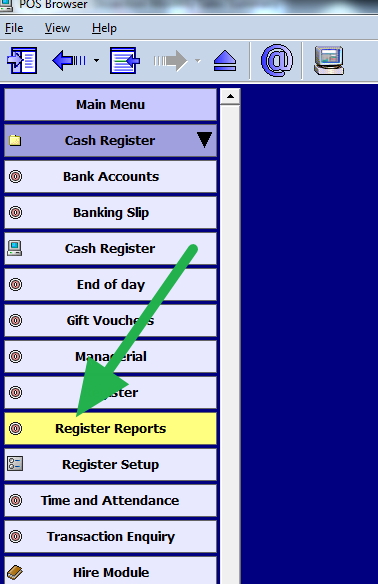
From the following menu, choose the "Monthly Sales Summary."
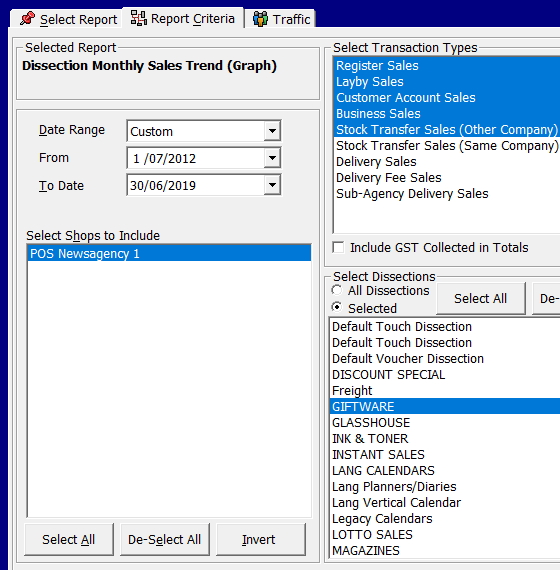
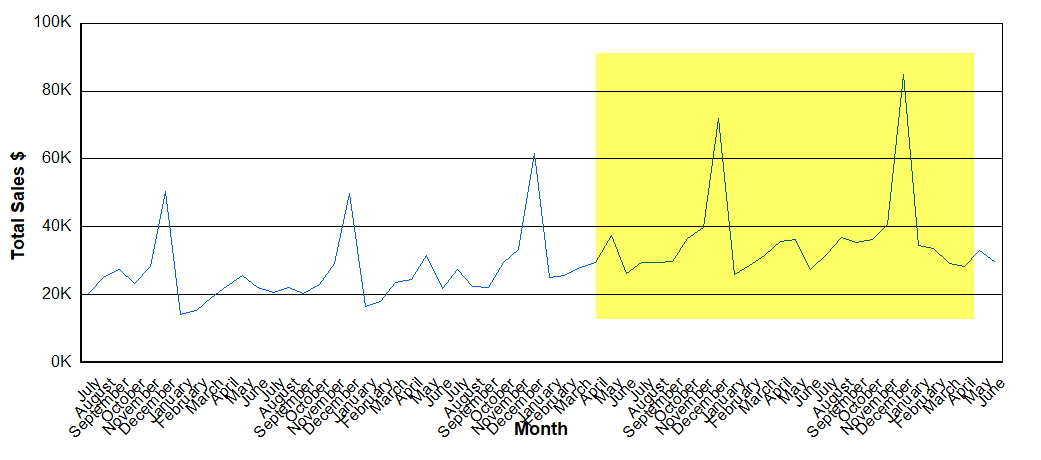
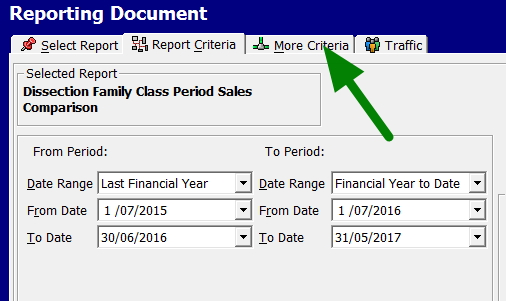
To get a comprehensive view, set the date range for the last 24 months. You can do more and less; please experiment with various options here later once you get a handle on this. The system here will generate a detailed report breaking down your sales by department and month, comparing this year to last year.
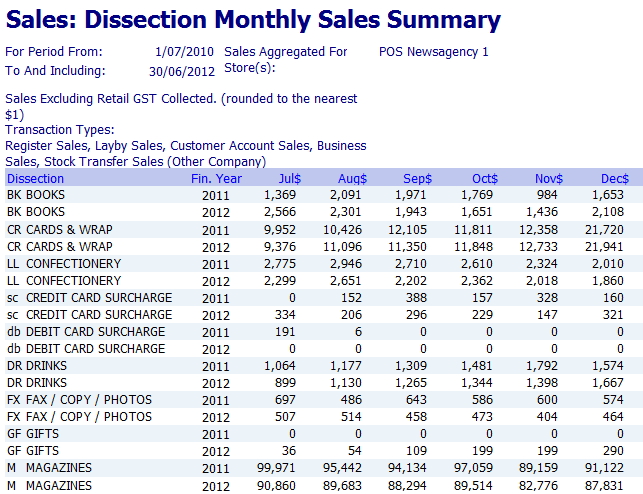
This report provides sales trends over time, highlighting both increases and decreases.
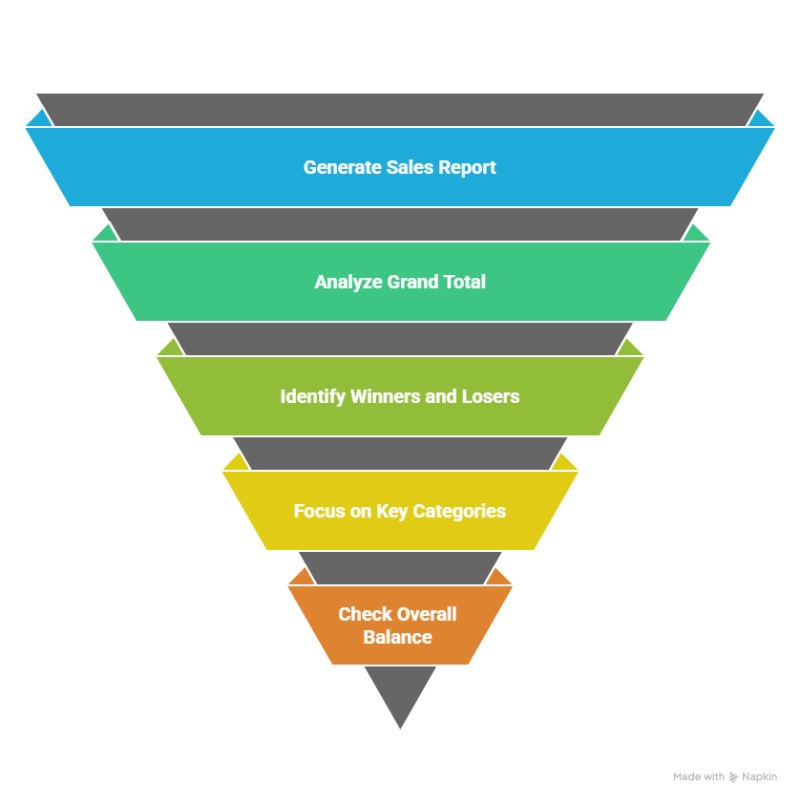
Once you run the report, don't let the numbers overwhelm you. It's made to be simple. You will see product categories listed on one side, with sales data from this year and last year in columns following them. This layout makes spotting trends easy. Use these five steps to focus on what matters most and uncover the valuable insights in your data.
- Start with the Grand Total
Before you look at anything else, find the total sales figure at the bottom. Is it higher or lower than the same time last year? It is your big-picture number, indicating immediately whether your business is growing or shrinking overall. - Spot Your Big Winners and Losers
Next, scan the report for the most significant changes in any single department. Which department had the most significant jump in sales? Which one had the biggest drop? These are the areas having the most impact on your business right now. - Focus on Your Star Players
Remember that some category changes are more significant. A 10% drop in your best-selling area is more substantial than a 50% drop in a minor category. Focus on key areas. - Check Overall Balance
Think of your business like a see-saw. Growth in some areas lifts you, dips in others pull you down. Are your top categories growing enough to offset declines? This quick check shows if you're winning overall. - Know When to Dig Deeper
Don't worry about every tiny change. Set a threshold, such as $200 or $300. If a change exceeds that, investigate further.
Turning Insights into Action
Finding clues is beneficial, but the real value lies in using them to make informed decisions. After identifying winners and losers, act on what you've learned.
When Sales in a Category Are Down...
Don't panic. It is your chance to get curious and make improvements. Ask yourself:
- Are my products still fresh? It may be time to bring in some new items for that category.
- Is my pricing proper? Take a quick look at what competitors are charging.
- Could I promote it better? A small sale or relocating the items to a better spot in the shop could help.
When Sales in a Category Are Up...
Great job! Now, build on your success by checking your inventory to avoid stockouts, expanding popular product ranges, prominently displaying top items, and considering price adjustments based on demand.
You're in Control of Your Business Story
Your POS system can provide you with data-driven insights to inform your decisions. Spend a few minutes monthly analysing sales data to understand your business.
Try running your Monthly Sales Summary this week to see what your data reveals.
Want real growth? Give us a call.
Written by:

Bernard Zimmermann is the founding director of POS Solutions Australia. With over two decades of experience in retail technology, he specialises in helping small to medium businesses harness their sales data for growth. Bernard is passionate about making complex analytics simple and actionable, empowering countless Australian business owners to optimise their operations, manage inventory effectively, and improve profitability through their POS systems.