Measure Your Shop's Valentine's Day Sale

Valentine's Day offers retailers a chance to increase sales, but achieving understanding involves more than just figures.
It's crucial to analyse your store's performance to determine what worked well and what did not and to improve. Here’s a guide to assist you in evaluating your Valentine’s Day sales.
Last-Minute Shoppers
Many Valentine's Day purchases are impulsive, so people buy even after the holiday. Please keep displaying your themed products for a little. Also, remember that some bargain hunters are now looking.
The Importance of Measuring Sales for Businesses
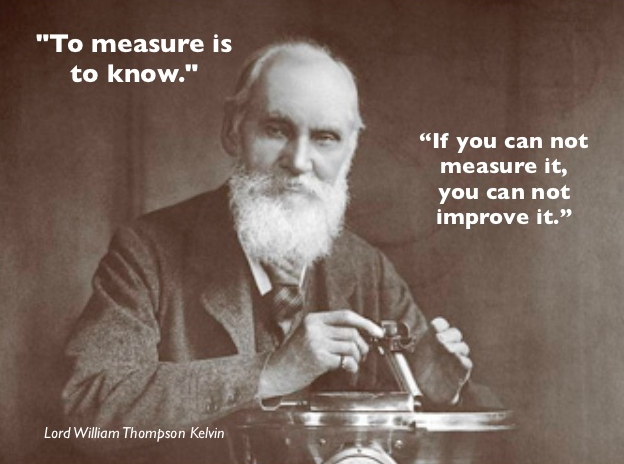
Businesses need to measure during busy seasons such as Valentine's Day. These days are unusual, and what you find on them can work against you because they are uncommon. This makes it harder to make decisions. Luckily, tracking sales has become more straightforward and practical with a modern POS system.
Sales Reports
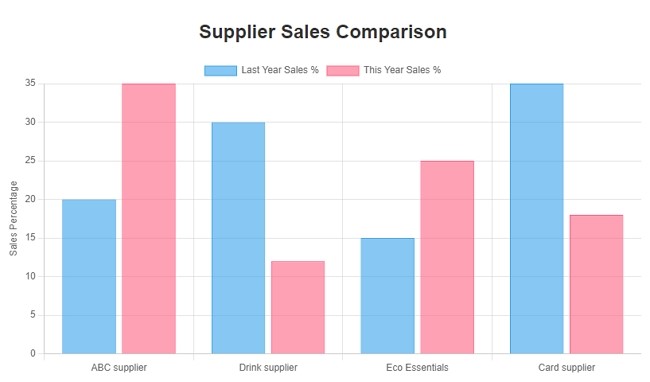
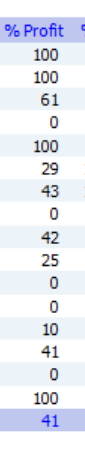
Sales reports are crucial tools for monitoring sales performance. They show your profit, bestselling products, and employee performance. Using these reports, you can identify trends and make data-driven decisions.
How to Track Sales Performance
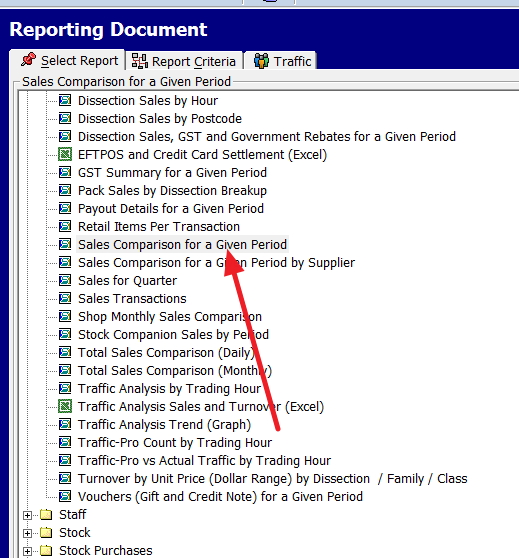
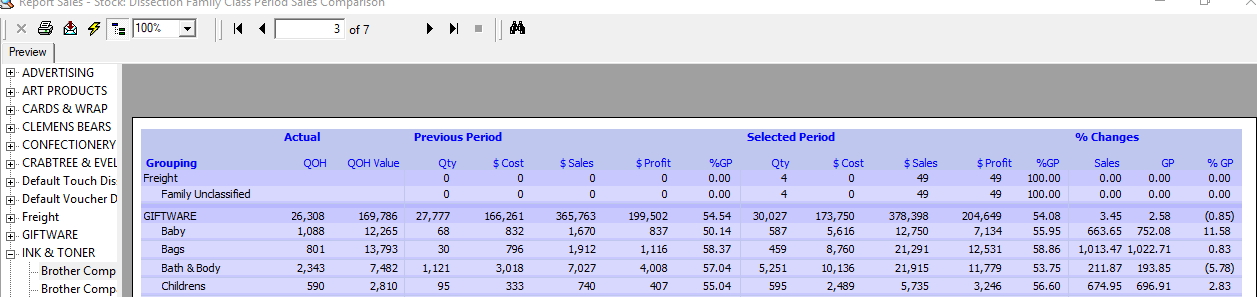
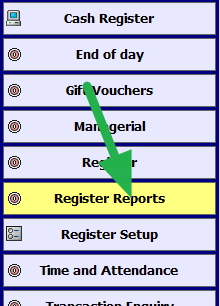
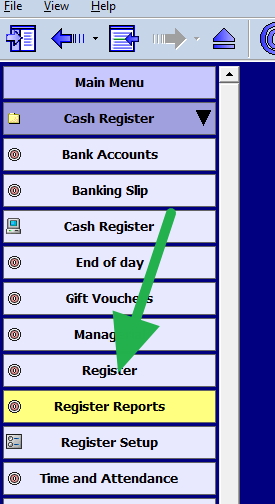
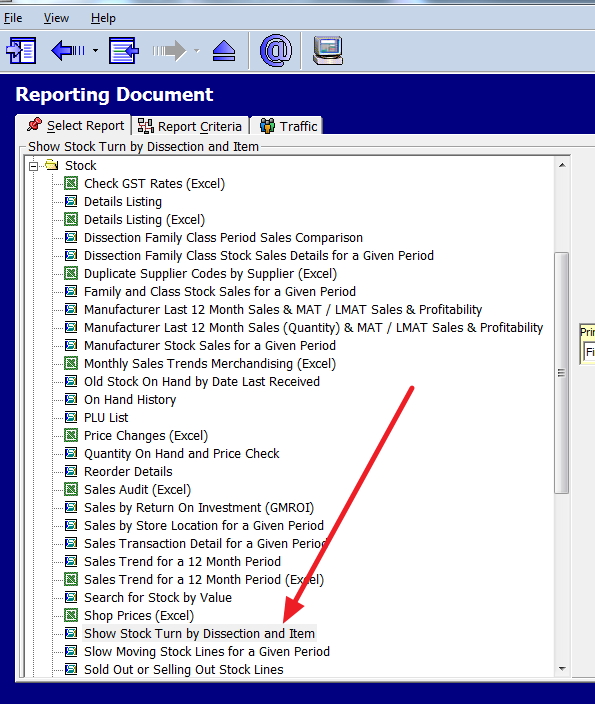
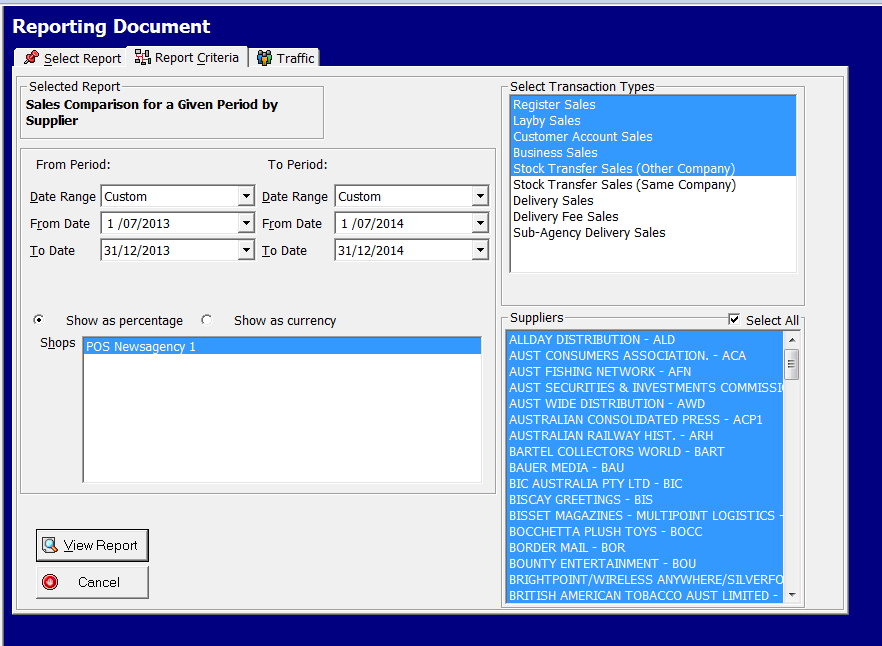
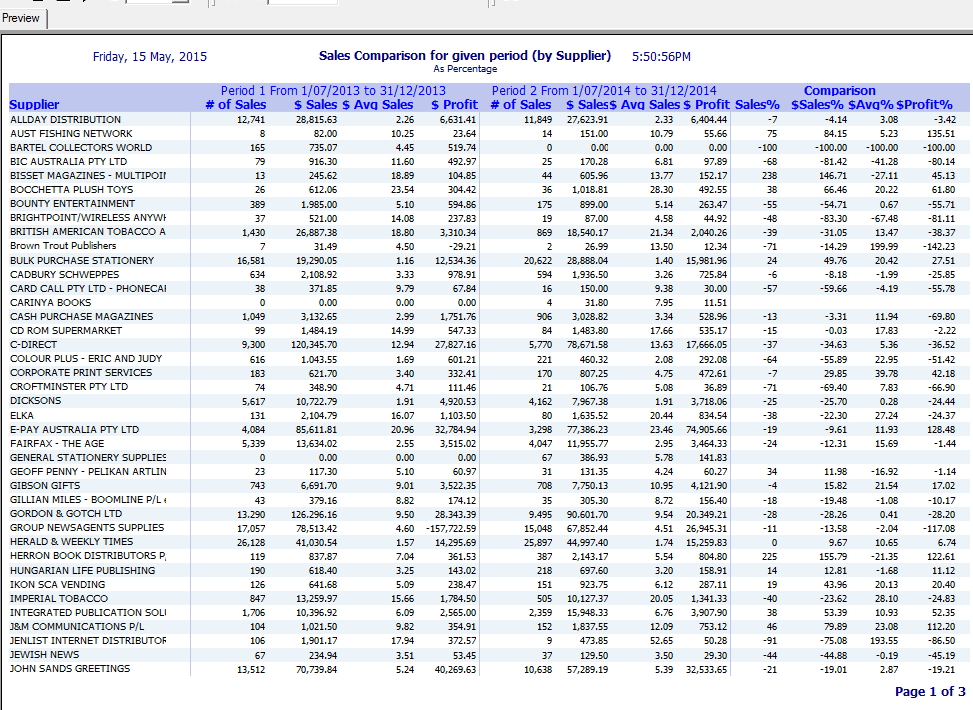
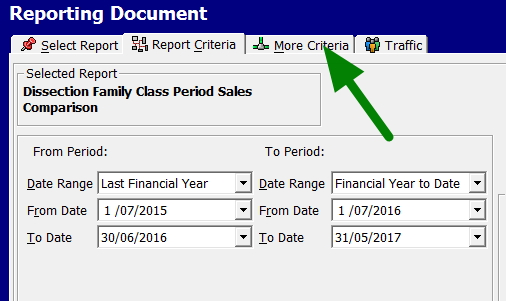
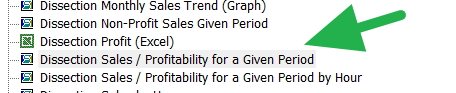
Go to reports and click on sales.
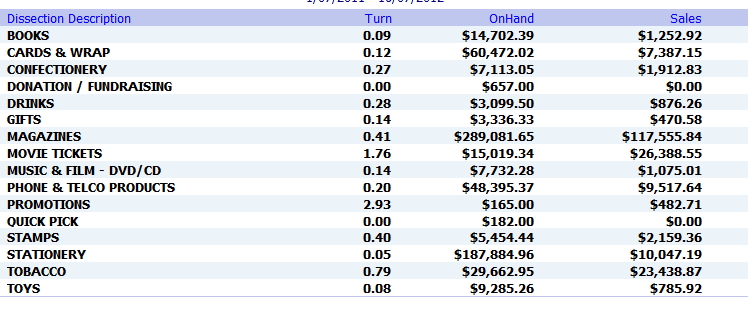
This report will allow you to check how each department in your shop is doing compared to previous periods.
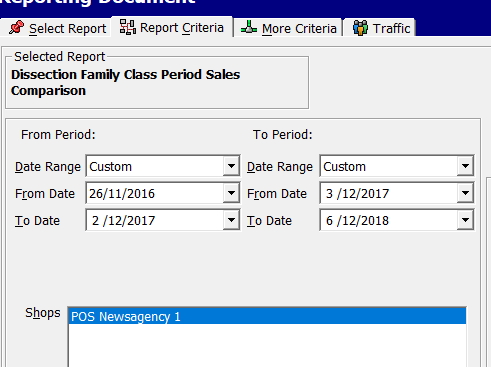
Now select the dates you are interested in, 14 February 2025 and 14 February 2024
I am ignoring all the extra options for this example. Please feel free to review this later after you work through this example.
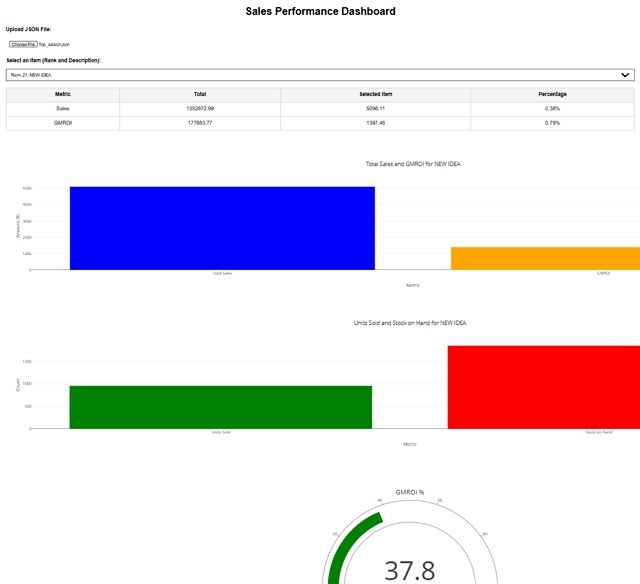
When reviewing reports, navigate the left-hand menu to focus on the most relevant departments. It will help you pinpoint areas of success and those needing improvement.
The advantages of utilising sales reports: By analysing sales data, you can determine, in particular, the bestselling products and employee performance. Your business strategy must be to gain insights to maximise profits. If you follow what happened on those days, you can identify trends that you need to make informed decisions. It will help your businesses make data-driven decisions.
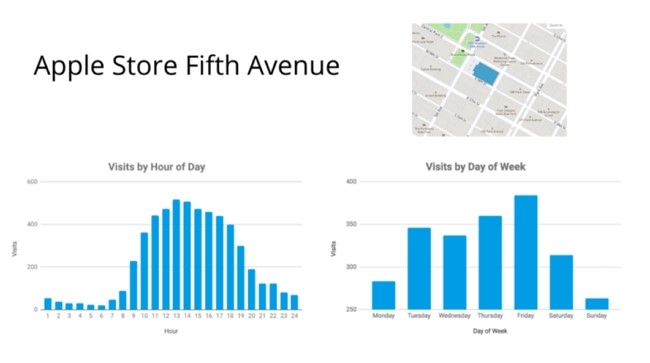
Another good way to measure sales on Valentine's Day is through employee sales analysis. It is interesting because, by analysing sales data, you can identify employees who perform well.
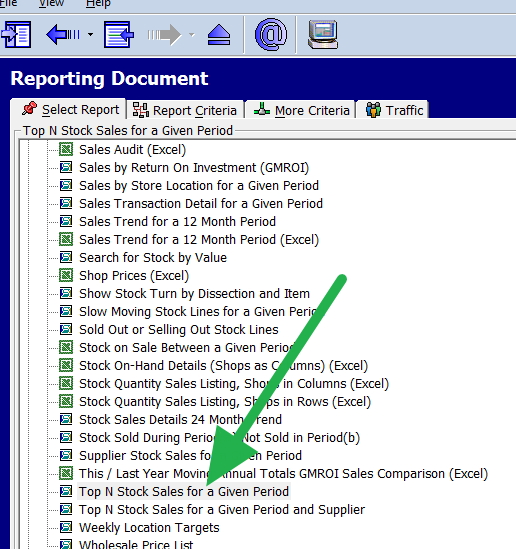
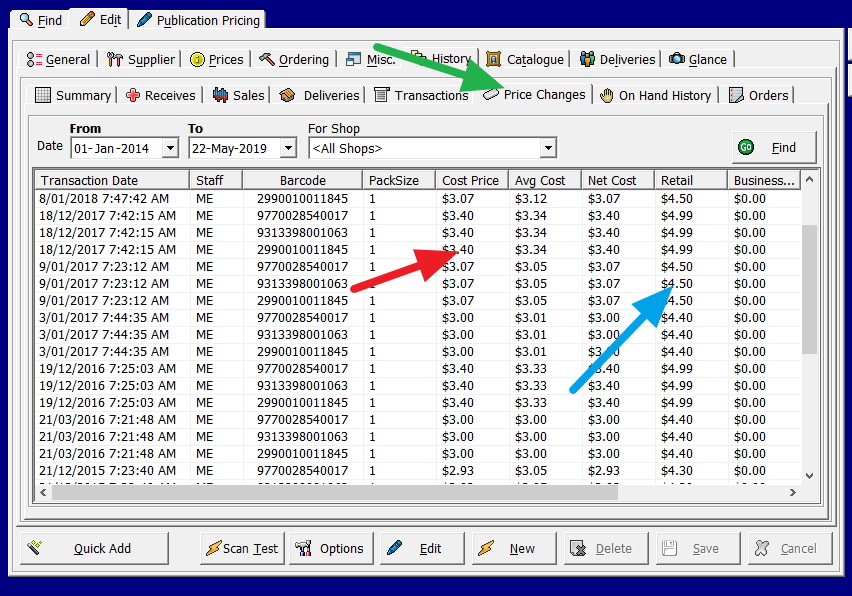
Top-Selling Products
Create a list of your best-selling items! Did red roses or heart-shaped chocolates fly off the shelves? Also, please remember items that didn't sell well; each has a story for me. In my experience, it's best not to fight the market if the public wants these heart-shaped chocolates from you; give them to them and do not try to do better.
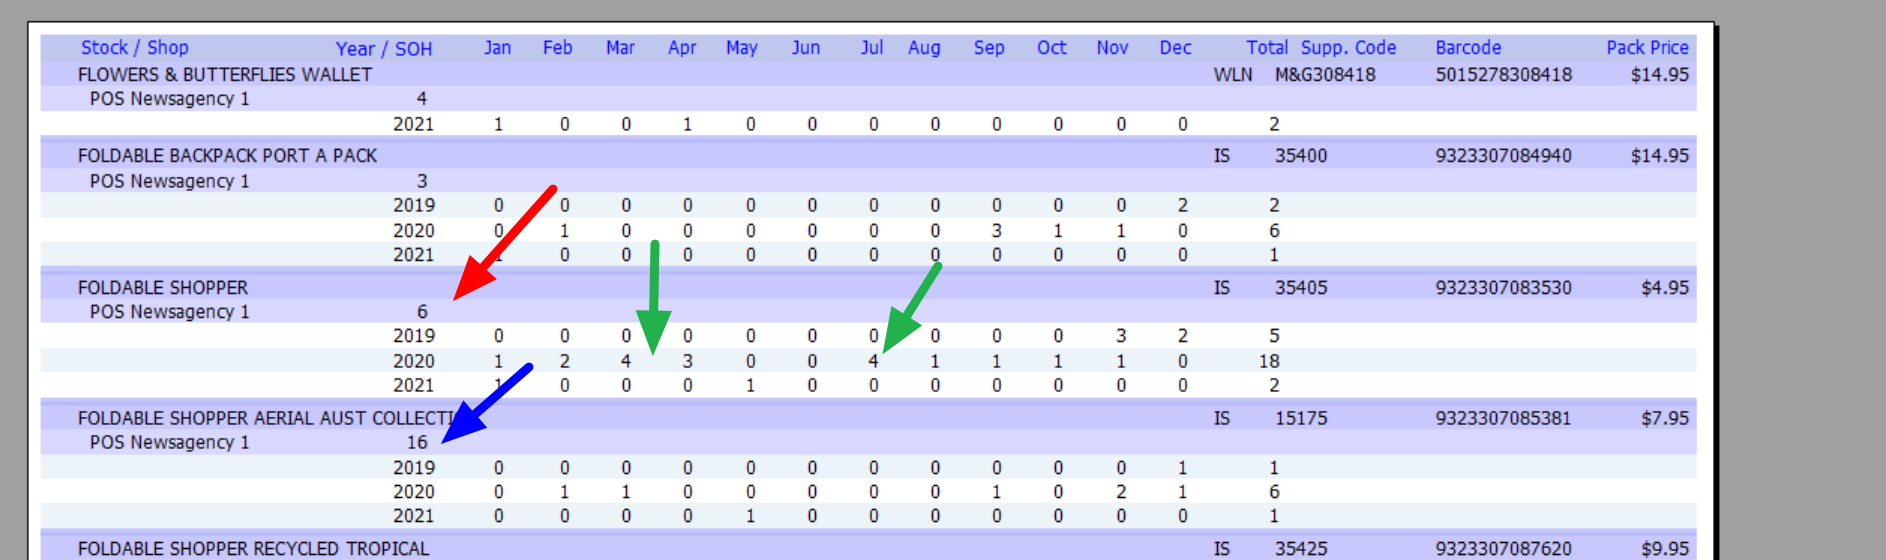
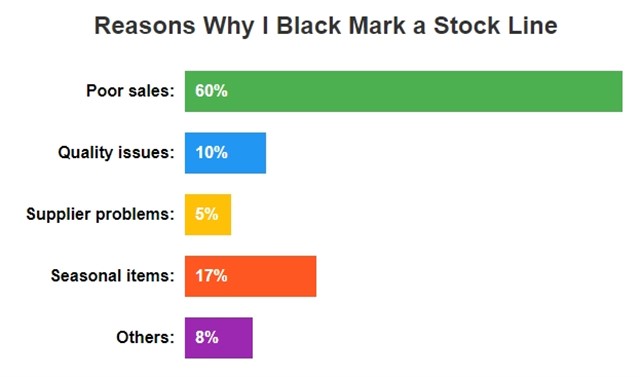
Leftover Stock
Everyone hates these items if they cannot be sold after Valentine's Day. These items highlight what did not resonate with customers, so if you're left with too many red candles or gift baskets, make a note for next year.
Sold-Out Items
Which products sold out too quickly is more important? These cost you money. For instance, if heart-shaped chocolates sold out too quickly this year, plan to increase inventory next year.
Summary
> Valentine's Day is an excellent time for businesses to boost sales, but it requires strategic planning and measuring sales.
> Measuring sales during busy seasons such as Valentine's Day is essential.
> Sales reports are great for monitoring sales performance.
> Employee sales analysis is another way to measure Valentine's Day sales. It can identify high-performing employees and those who need more training. Using this information, you can boost sales.
Businesses can use this information to boost sales and customer satisfaction.