

My last blog post about using POS system reports generated a lot of discussion. Many clearly use their POS System only as a cash register when it can offer so much more. A shop accessing their sales data through reporting can be a real game-changer.
Detailed sales reports provide valuable insights that allow for better decision-making. With just a few seconds, you can access actionable information to boost profits.
Why sales reports matter
Now, one essential report every retailer should utilize is sales performance. Some key advantages include:
- Identifying top-selling items so you can focus on the best performers. Stock more of your winners.
- Uncovering slow-moving or non-selling inventory. Make room for new items by removing dogs.
- Recognising sales trends over time. Adjust purchasing to match patterns in customer demand.
- Pinpointing your most profitable departments or product categories. Concentrate inventory accordingly.
- Discovering when your highest sales occur. Schedule staff and inventory delivery optimally.
With these kinds of actionable insights, you can tweak strategies to maximize revenue. So, let me show you how to access sales-by-item reporting in your POS system.
The single most helpful report: Top-selling items
Now that we've covered why sales reports matter, let's discuss the #1 report every retailer should use regularly: Top selling items.
This report provides a ranking of your best-performing products based on sales over a defined period. Typically, we find the last three months work well.
Here are some specific ways the Top Selling Items report can help your business:
Optimise inventory levels
By knowing which products sell best, you can allocate more shelf space, budget and marketing resources to your winners. Likewise, you may choose to cut back on slower items. This report gives you the data to manage your product mix based on actual sales results.
Spot new growth opportunities.
When you run the report over different periods, you can identify rising trends. Newer products that are quickly gaining traction present opportunities to capture new growth. You may want to order more inventory or create a promotional display.
Analyse performance by department or category.
Comparing top-selling items by department or product category. This allows better inventory planning. For example, bottled water is topping sales in the beverage aisle. You can then adjust the beverage inventory and shelf layout appropriately so water is at eye view in front.
Assess seasonal impacts
The seasonal calendar has a big influence on sales trends. Run the report monthly or quarterly to see how top sellers change as you move through the year. This helps anticipate peaks and valleys in product demand.
Identify declining products
Just as the report highlights winners, you can also pinpoint slower products needing corrective action or discontinuation. By regularly reviewing the bottom half of your sales ranking, you can quickly address laggards.
How to run the Top Selling Items report
Now that we've covered the value of the Top Selling Items report let's walk through how to generate it in your POS system. I'll use our point-of-sale software as an example, but the process is similar across most platforms.
Here are the simple steps:
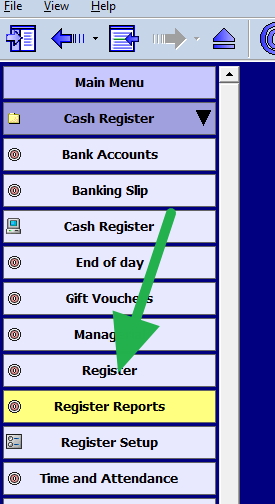
Go to Register reports.
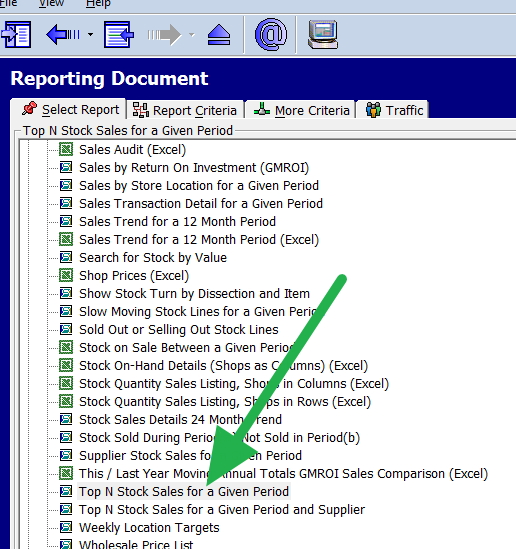
Now select "Top N Stock Sales for a Given Period."
You will want about 100 items with the last three months of sales for the shop, and you will get a report that looks like this:
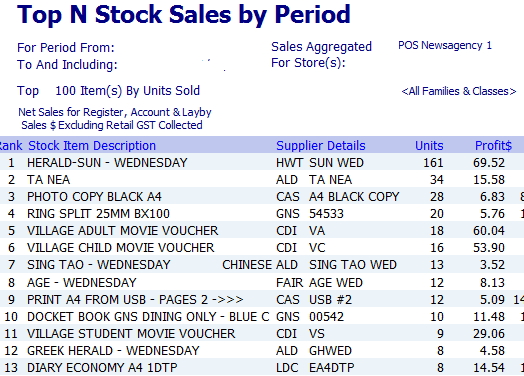
It's that easy - in just a few clicks, you have accessed incredibly useful data to boost sales and profits.
Tips for getting maximum value
To gain strategic value from the Top Selling Items report, keep these tips in mind:
-
Run it regularly - I suggest monthly. The more consistent you are, the better you can spot trends over time.
-
Use custom date ranges - Look at the next three months of last year, so say 01/11/2022 to 31/01/2024, this will give you an idea of what is coming up.
-
Do it by department - It is often useful to work by department, top sellers should be at eye height and right in front.
-
Look beyond the top ones - You will often find much interesting towards the bottom of the list
-
Make it actionable - Don't just run the report. Actually use its insights to do business decisions.
Key takeaways
Here are the significant points to remember about using your POS system's Top Selling Items report:
-
Provides invaluable visibility into your top-performing products based on actual sales data.
-
Helps optimise inventory levels, identify new growth opportunities and inform promotions.
-
It can be segmented by period, department, product category and location.
-
Simple to run - just select time range and run.
-
Analyse regularly and act on trends to control costs, boost margins and improve overall business results.
Update: This article was initially written on 26/04/2022 and was updated to 1/11/2023

