Data is the difference between thriving and getting by in today's retail. Retailers who understand their POS System are not guessing; they're making intelligent, informed decisions, which gives them a real edge. The key to your business's success lies in taking actions that drive actual results.
Your POS system has the information to help you. It's there, waiting for you to dig in. Here is how to get some insights together to use them in 2025. Use these insights to transform your business performance and set the stage for a successful 2025.
Getting Started: Your First Data Deep Dive
Here's how you can tap into this resource to gain a clear picture of your performance:
Accessing Your Sales Comparison Report
I think knowing where your business is going is essential.
Now is an appropriate time to take a quick look at how well you did in 2024, where you are now in retail strategy and compare your performance to previous years.
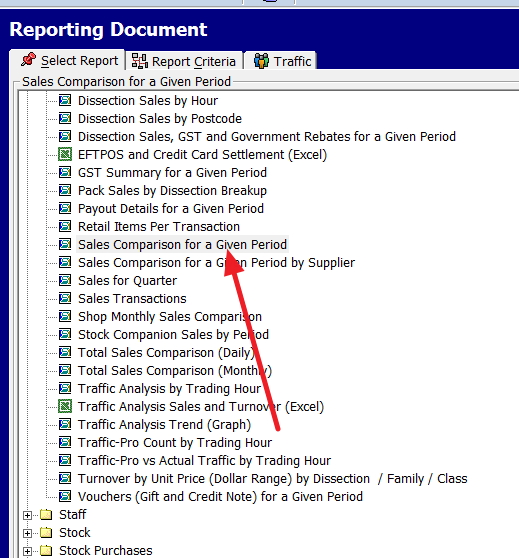
Go to register reports.

Now select the item marked "Sales Comparison for a Given period".
Key Performance Metrics to Track
We'll first examine data from 2021 to 2024 to view your business movements. Here's how to do it:
Conducting a Four-Year Analysis
-
First Comparison:
- Input the date range: 01/01/2023 to 31/12/2023 AND 01/01/2024 to 31/12/2024.
- Run the report and note key figures
-
Second Comparison:
- Return to the report and input: 01/01/2022 to 31/12/2022 AND 01/01/2024 to 31/12/2024.
- Record key statistics
These data points give you a solid foundation for understanding your business's performance over the past two years.
Visualising
A simple graph of your annual turnover can provide a clear visual representation of your business's growth trajectory.
Go to the Cash register.
Then go to Sales - Register Select Dissection Monthly Sales Trend (Graph)
Now, I like to start with a long view first.
So you can choose 4 years to get a feel.
Please select the date range, in my case, 01/01/2021 to 31/12/2024
As you examine your four-year sales data, ask yourself:
- Is there a consistent upward trend in turnover?
- Are there any noticeable dips or spikes? What might have caused these?
- How does your 2024 performance compare to previous years?
- What factors might have influenced your sales performance over this period?
Now, go back and look at the past two years. Two years is good, as you can see from the seasonal variations, e.g., Easter before and the most recent.
Remember, this analysis isn't about numbers. It's about understanding the story. We are using these numbers to gain insights that will help us make a strategy for 2025 and beyond.
Leveraging Advanced POS Features
While this simple analysis provides valuable insights, your POS system offers even more advanced reporting capabilities. Use these features to uncover powerful insights that will drive your business decisions:
Looking Ahead: Your 2025 Strategy
Armed with these insights, you're well-positioned to craft a strategy for 2025. Consider:
- Setting realistic growth targets based on your historical performance.
- Identifying areas for potential expansion or improvement.
- Planning inventory based on observed trends.
- Develop marketing strategies that align with your sales patterns.
For instance, if your data shows a 15% growth in clothing, consider expanding this category and highlighting it in your 2025 marketing plan.
Conclusion: The Power of Data-Driven Decision Making
I want you to know that understanding your business's performance is invaluable.
I can guarantee your competitors are using these insights to get ahead of you now.


