
Easily use Graphs in your Business Intelligence.
Are you struggling to see what the computer data in your POS Software is showing you?
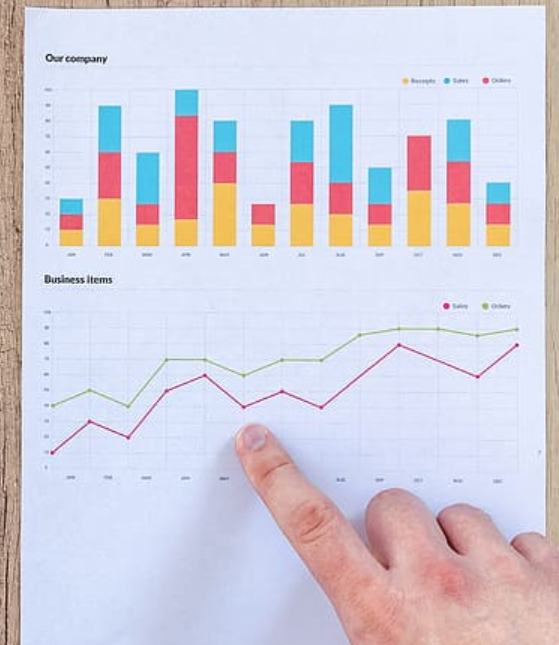
It is crucial to observe your business comprehensively and accurately. I have noticed that people tend to respond and process pictures better than a mess of numbers. That is why our POS Software has graphs which makes it easier for you to see the trends in your business. What you can do instantly is make graphs of your sales over time. By doing this, you will be able to see how your business is moving quickly.
How to use this powerful Business Intelligence Tool to Bring Your Data to Life instantly
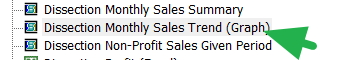
Go to your reports> Sales> Dissection Monthly Sales Trend (Graph)
Now for the first attempt, I am going to make it quick and easy. Once you get this part under control, you can build up from there.
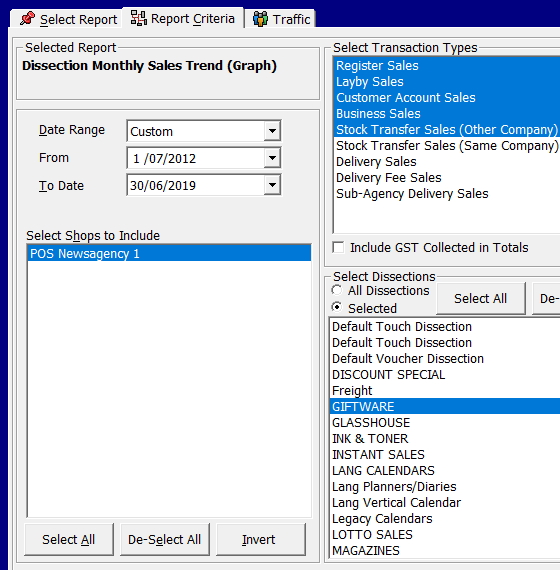
Generally, when I start, I pick a very long period. This is as I like to look at the long-term trend first, so I used seven years.
I tend to look at everything first, but when I examine, I look by the department. The whole shop itself often has so many different patterns it gets challenging to get a simple answer. Plus, everything does not tell you what is going well and what is going badly. I picked first here giftware as an example.
Now I get this graph.
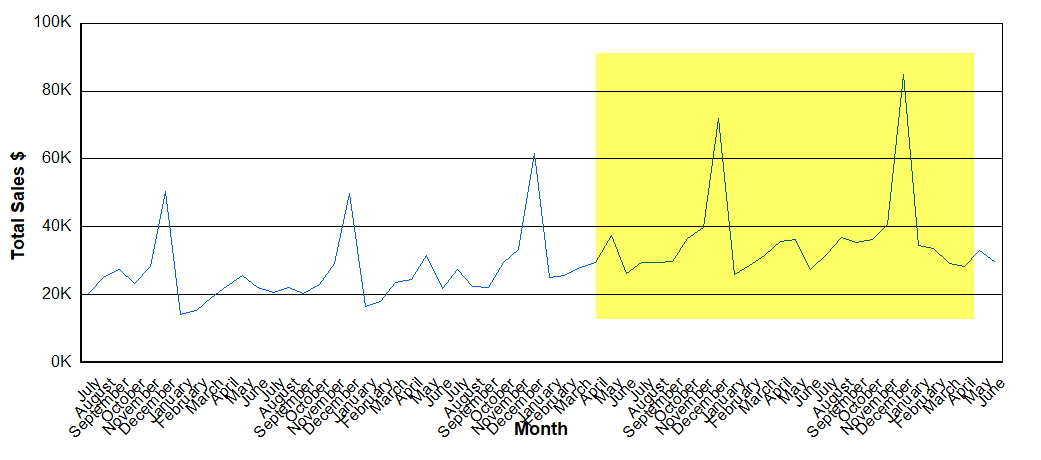
Looking at it, you can see a long-term pattern. Notice how the Christmas peaks are getting higher over time. Also, notice how giftware has gone from a range of 20K to 50K a month to 30K to 80K, so something is going well here.
Have a go!

