Talking with your staff about your shops is a rewarding and useful exercise and can provide you with valuable observations.
It takes a lot of study to make sense of a row of figures say of GMROI and stock turns. Without that study, they do not mean much to anyone. Besides in this case, its part of the activity that the staff have little to do, this information is more relevant for a discussion with senior management or financial consultant.
Typical measurements that are more meaning full to staff would be the average basket size and amount, the number of customers during the day, when they come, what sort of items get sold during the day and so on. This important you tend to find in the sales and rostering systems.
Then what is important is that the information needs to be produced in a graphical form so that it is easy to understand and digest. This is why our point of sale has so much of its information available visually. Unlike others, we provide all this to our users free.
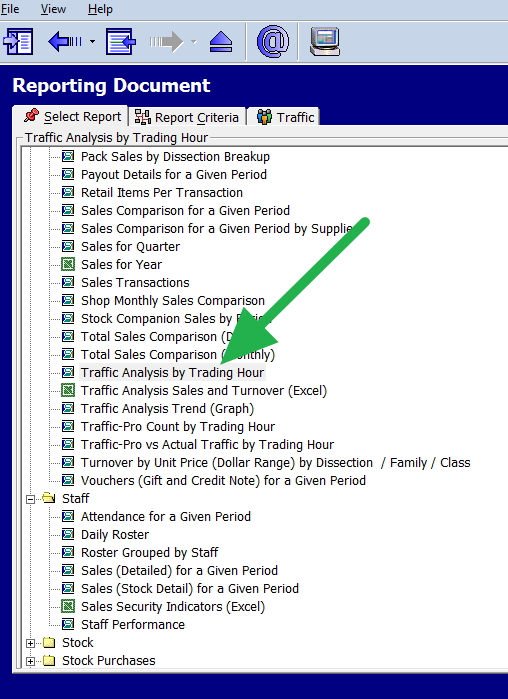
In this example, one report that I do recommend is the traffic analysis by the hour which you will find marked with a green arrow below.

Among the detailed output produced; you will find a colour coded analysis from blank to red, which shows how active the shop was divided into four groups with red the busy period.

This report anyone working in the shop can discuss. When we are busy and when we are not.
There are others in that section there that would be equally productive to discuss, which give traffic analysis by sales, turnover and trend all with graphic. I am sure discussing these measurements can highlight possibilities for improvement.


