
What you can do in your POS System is set a budget for each department? Now here is a quick way that works well how to calculate such a budget in a typical shop which will take you less than five (5) minutes to do. Of course, no shop is standard, but what do you want for less than five (5) minutes of work.
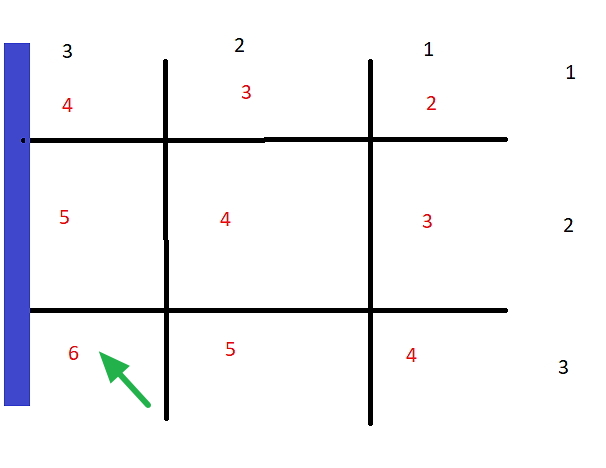
Divide the shop into nine segments, as I have done above.
Now on the top in black, you will see the scores 3, 2 and 1. This is because, in Australia, people tend to go to the left when they go into a shop, so the left of the shop is more valuable.
Similarly, on the side, you will see the scores 3, 2 and 1 in black. This is because the front of the shop is more valuable than the rear.
Now when you add them up, you will see in red the totals, which is the addition of the top and side scores.
Now, add another 4 to that area segment where most of the front counter is.
If you are setting a budget, you take the total shop budget. Your call whether you do it as profit or sales. Divide by forty (40) and multiple by that segment total, for example: if the shop's budget was $800,000 a year. For the bottom front segment, see green arrow its budget would be $800,000 / 40 x 6 = $120,000
Now there is one caveat: the very front of the shop is used for display and is a decongestion zone where people often walk through without thinking. This part varies so much in different shops that you must make your own value.
The quickest way to proceed is to run a totals report for the past twelve months. Now take your total sales and divide it by 40. Now multiple by its total above for each area segment giving you a figure for each area segment.
Now for each department, look at its area segment and note its figure. If three departments share a segment, divide it by three and use this figure on the report. If a department is in a few areas, add the figures up. Now see how its sales figures compare to these figures. Maybe you have some rearranging to do?
Now here are some key points using this analysis.
1) On the right of the diagram, you will see a thick line in blue. Once people enter your shop, most shoppers will turn to the left. Count the right (4+5+6=15 points) and compare it to the left value (2+3+4= 9 points)—a big difference in score.
This left side is what we call your power wall, as this is where customers naturally end up. It is where much of a shop's sales occur, so make sure it looks attractive. Style it up. Have your high-margin items there.
You can see why large suppliers, e.g. card companies, want you to put their product on the right side of the shop. They have done this maths too.
2) Why do most retailers prefer the front counter on the left of the shop? The space is less valuable there.
3) Why do many retailers like counters on the back. Well, the area there is less valuable.
Have a go; I am sure you will find these five (5) minutes of work helpful.

