As a retail consultant, I am excited about how AI can be used to support small—and medium-sized business (SMB) retailers.
We decided to address the problem of receiving too much information today. No one has time to wade through the mountains of reports we are getting, so I decided to test which free AI solution will deliver results for your shop.
We chose free because most SMB retailers are currently experimenting with AI, and as a result, many are utilising free AI solutions. There is no point in testing something few are using.
We extensively evaluated six leading free AI tools to answer this question, testing them against real-world retail reporting scenarios. We made and rated over 200 reports in total. What we discovered might surprise you, but the results certainly did surprise me. This analysis will be helpful and save you a lot of time.
What the test is addressing
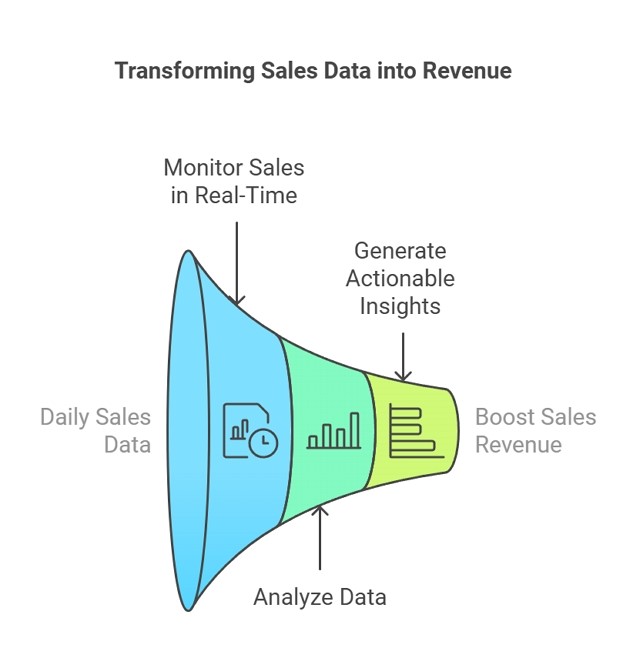
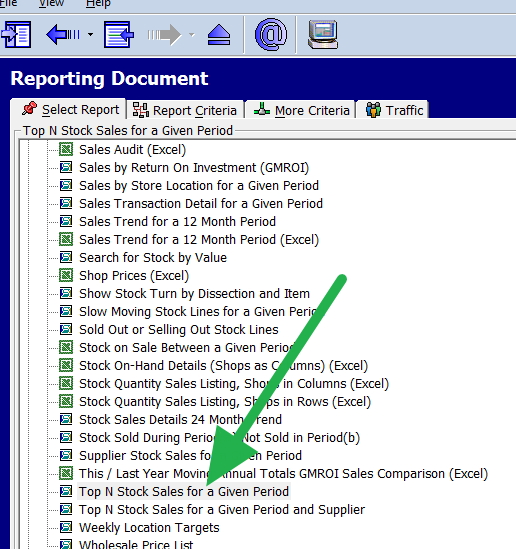
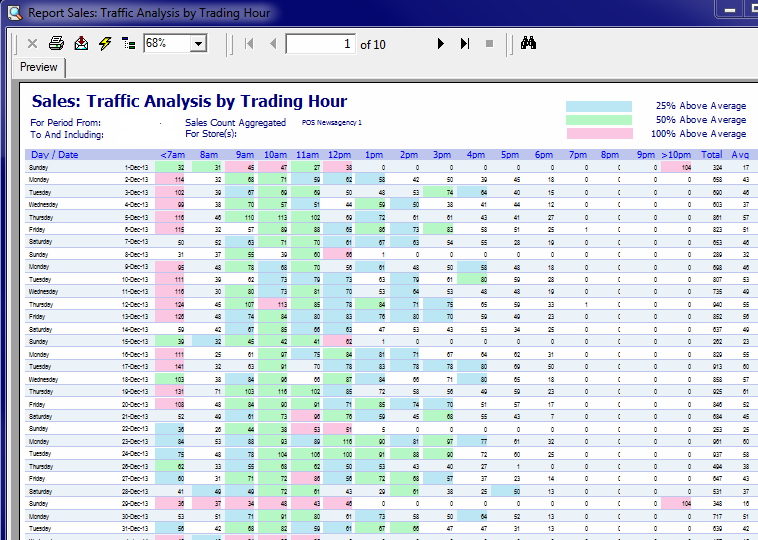
There is a significant gap between the data and the time and knowledge needed to use it effectively. A modern POS system like ours generates hundreds of reports, which require considerable time to review to identify sales patterns, inventory levels, supplier performance, and financial statements. However, finding time to extract meaningful insights from these reports is another matter.
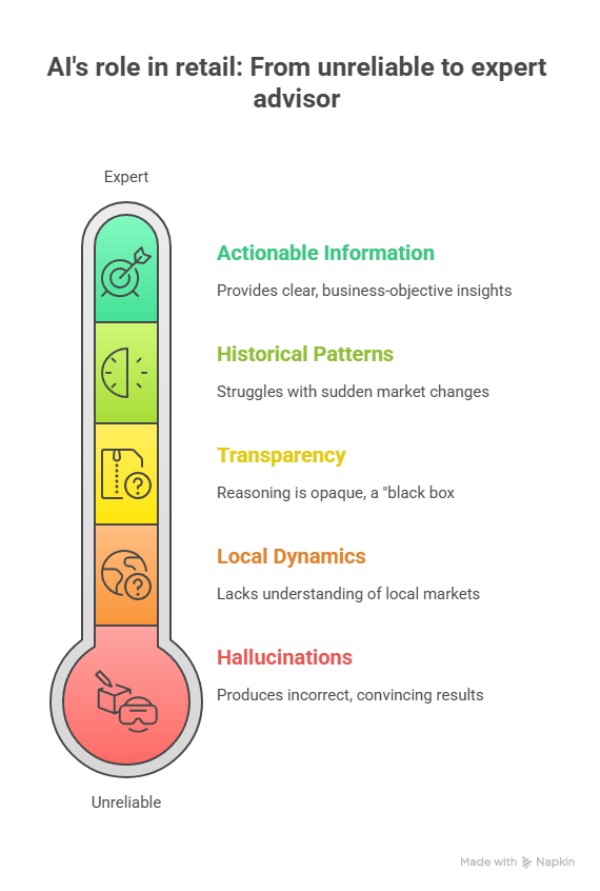
Yet the promise is that AI tools can do this and quickly process reports, identify trends, spot anomalies, and suggest actionable improvements.
The Free AI Landscape
Like so much in the world, not all AI tools are equal; some are better than others, and each one has account limitations.
We tested six popular tools to help you navigate these options:
ChatGPT (OpenAI)
Claude (Anthropic)
DeepSeek
Google AI
Grok 3
Qwen
Now, we know that all of them are good, but there is always a case where even the best six runners in the world have one who is better, and that is what we wanted to find out: the best free AI for retailers.
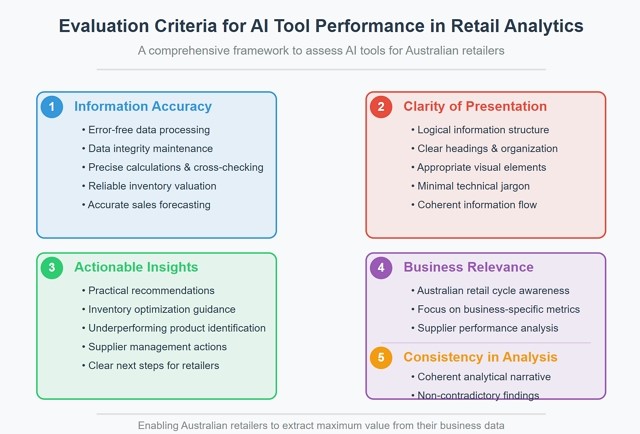
Each tool was evaluated on its ability to handle our tests based on these criteria:
Accuracy formed the cornerstone of our evaluation. Without accurate information, even the most sophisticated analysis becomes worthless for making informed business decisions. We meticulously verified whether each AI tool could process retail data without introducing errors or misinterpreting figures. This involved cross-checking calculations against known values and assessing whether the tools maintained data integrity throughout the analysis. In retail, where margins are often tight, minor inventory valuation or sales forecasting inaccuracies can lead to costly mistakes.
Clarity of Presentation
Accurate information is only valuable if presented in an understandable format. We assessed each tool's ability to structure information logically with clear headings, appropriate visual elements, and a coherent flow that retail managers could easily navigate. We examined whether complex data was transformed into straightforward insights that wouldn't require a data science degree to interpret. A good report should communicate the key points to a retailer without requiring them to wade through jargon.
Actionable Insights
Data without direction offers limited value to retail businesses. We evaluated each tool's ability to convert raw information into practical recommendations that retailers could implement. I am very proud that our POS system provides our customers with tools they can utilise. I want the AI report to do the same. I want to know what specific opportunities were identified in my inventory optimisation, which products are underperforming, and what concrete actions I need to take from my supplier. Good tools should describe what is happening and what should be done next.
Business Relevance
We evaluated each tool's ability to focus on issues that matter most to Australian retailers rather than generic business statistics. Did the AI for example identify seasonal trends in an Australian retail cycles, did it highlight my supplier performance to my business. Information that is not relevant creates noise rather than value.
Consistency in Analysis
Consistency in reporting is crucial for tracking performance over time and making reliable comparisons. We examined whether each AI tool maintained a consistent approach to analysis in its report and whether its outputs provided a coherent narrative. We do not want contradictory findings. Retailers need to trust that the insights they receive follow logical patterns and don't send them in conflicting directions. Inconsistent analysis can lead to confused decision-making and undermine confidence in the technology itself.
This comprehensive evaluation framework enabled us to assess each AI tool beyond its surface capabilities, focusing instead on how effectively it would serve the practical needs of Australian retailers wanting to extract value from their business data.
Test 1: Long Trend Stock Report Analysis
The first test was designed to evaluate how the AI would perform if it were given a vast amount of data that retailers are receiving. If the AI cannot handle the data, it's of minor use to retailers. Retailers have lots of data today.
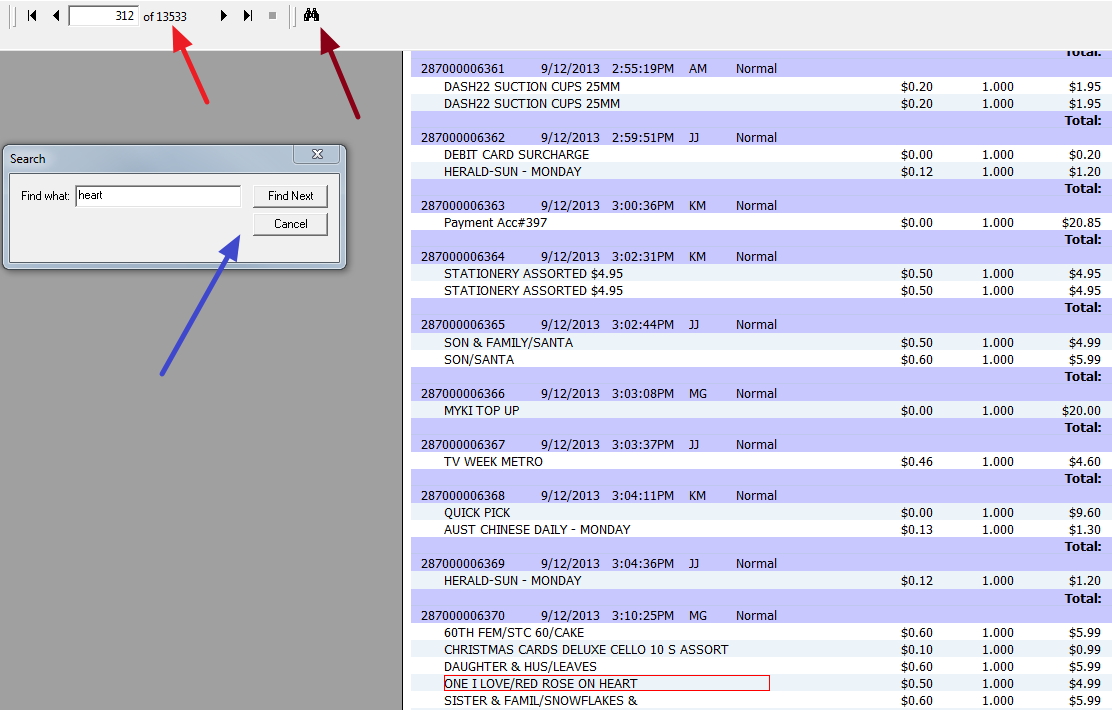
Now, understanding inventory performance is critical for any retailer. Seasonal trends, slow-moving items, and bestsellers all impact their bottom line, so we ran a comprehensive stock trend report spanning hundreds of pages. It's the kind of data most retailers can obtain but rarely find the time to analyse correctly. Our test data spanned 12 months and exceeded 300 pages in length.
ChatGPT
Failed almost immediately, as it ran out of credits, rendering it essentially useless for comprehensive stock evaluation. Even before hitting its limits, it failed to provide actionable insights that would aid practical retail decisions. The reality is that a retailer, after running this report, would almost certainly want to rerun it to see whether anything different changes the outcome. I might have tested this year and last year, but here I get nothing. As such, we immediately dropped ChatGPT.
Claude
Initially performed better. It identified some fundamental product trends on the first run. Then it ran into credit limits. However, it did identify some fundamental product trends, but its inability to handle follow-up questions made it impractical for the iterative nature of retailers' needs. As such, we dropped it immediately.
DeepSeek
Attempted a different approach to the credit limit problem. It took only a tiny section (6%) of the information. While this allowed it to complete the task without running out of resources, it did not give much.
Google AI
The first problem was that Google required CSV files, while all the others accepted Excel format, which we preferred. However, it did identify fundamental product trends; however, we all felt it lacked the depth needed for effective inventory management. Its surface-level insights wouldn't provide much of a competitive advantage for retailers looking to optimise stock levels.
Grok 3
Boy, were we impressed with this AI. It took the entire report without issues. It then provided a detailed trend analysis that would help retailers make smarter decisions. For example, it identified some products specifically for BBQs and reported that they sold well during the summer. It also spotted anomalies that would be easy to miss in manual review, such as products that underperform only during specific weather conditions.
Qwen
It performed admirably by identifying anomalies and supplier diversity trends, though it didn't match Grok 3's depth. It correctly helped identify problematic stock items. Unfortunately, it offers fewer actionable recommendations for improvement than Grok 3.
ChatGPT failed
| AI Model |
Ave Score |
| Grok 3 |
9/10 |
| Qwen |
8/10 |
| Google AI |
7/10 |
| Claude |
7/10 Limited |
| DeepSeek |
7/10 |
Test 2: Trial Balance Analysis
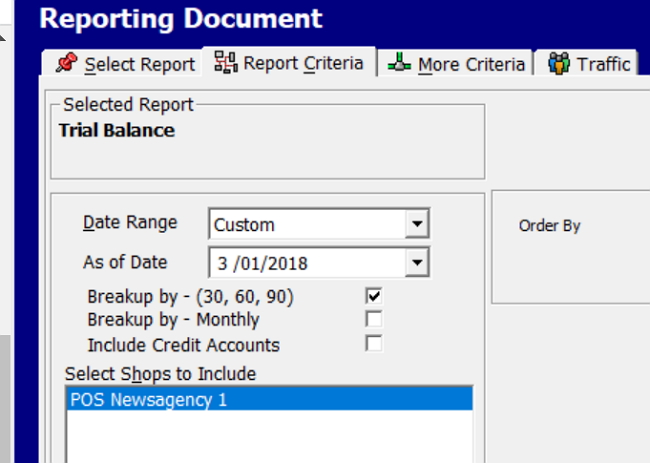
Accurate financial reporting is the backbone of retail success. The second test focused on a small compact trial balance dataset. What we wanted was an analysis that didn't require an accountant to understand.
DeepSeek
It produced precise observations but struggled with depth when analysing discrepancies. Its summarised approach meant that nuanced financial issues, which could significantly impact a retail business, were overlooked.
Google AI
Here, we got straightforward summaries that aligned with our general ledger data but it lacked depth in identifying anomalies. We felt that although it was helpful for essential reconciliation, it wouldn't alert a retailer to subtle patterns.
Grok 3
Wow, it delivered a detailed financial summary with cross-referenced data for accuracy. It flagged discrepancies that required further investigation, allowing us to explore these issues. This capability could be invaluable for retailers without accounting expertise in maintaining the financial health of their business.
Qwen
It did a good job of highlighting significant balances and unexpected changes effectively. Again, it did not match Grok 3's level, but it did come up with much good stuff.
| AI Model |
Ave Score |
| Grok 3 |
9/10 |
| Qwen |
8/10 |
| Google AI |
7/10 |
| DeepSeek |
6/10 |
| Claude |
N/A |
Test 3: Supplier Purchases Report
Managing supplier relationships is critical for maintaining healthy margins and consistent product availability. The third test examined a supplier purchases report to evaluate performance, track expenditures, and identify inefficiencies.
DeepSeek
It did produce some quick overviews. It struggled with detailed metrics, such as cost per transaction or order accuracy. Its summarised approach meant it missed some critical inefficiencies; we did not think it was trivial, as these sorts of things directly impact margins.
Google AI
It did provide a structured summary but lacked in-depth spending analysis by category or supplier benchmarking. While helpful for basic understanding, we did not see key KPIs, such as identifying problematic vendors.
Grok 3
It did offer comprehensive supplier evaluations with detailed metrics. It identified inefficiencies. We thought it was suitable for managing dozens of suppliers. It was good, with its actionable tips.
Qwen
It did highlight anomalies as well as Grok 3 in the supplier but lacked actionable details.
| AI Model |
Ave Score |
| Grok 3 |
9/10 |
| Qwen |
8/10 |
| Google AI |
7/10 |
| DeepSeek |
6/10 |
| Claude |
N/A |
When evaluating these tools specifically for retail applications, clear patterns emerged across all three test scenarios:
| Tool |
Stock Analysis |
Financial Analysis |
Supplier Analysis |
POS Integration |
Overall Rating |
| ChatGPT |
We do not think its free version is suitable for retailers. |
Failed |
| Claude |
Limited |
Accurate but limited |
Decent but restricted |
Good |
6/10 |
| DeepSeek |
Partial (missed trends) |
Clear but shallow |
Quick but surface-level |
Good |
6/10 |
| Google AI |
Consistent but basic |
Straightforward |
Structured but limited |
Limited |
7/10 |
| Grok 3 |
Comprehensive |
Detailed |
Comprehensive |
Good |
9/10 |
| Qwen |
Good anomaly detection |
Highlighted changes |
Good diversity insights |
Good |
8/10 |
Practical Implementation for Your Retail Business
Understanding how these tools perform in controlled tests is helpful, but implementing them in your daily operations is where real value emerges. Here's a practical approach to leveraging AI for business improvement.
Start Small and Focused
Begin with a specific business challenge rather than trying to analyse everything at once. Consider identifying your slowest-moving stock items for clearance, evaluating which suppliers offer the best value for similar products, or analysing sales patterns to optimise staffing during peak hours. Starting with a focused approach allows you to see tangible benefits quickly while building your comfort with the technology.
Prepare Your Data
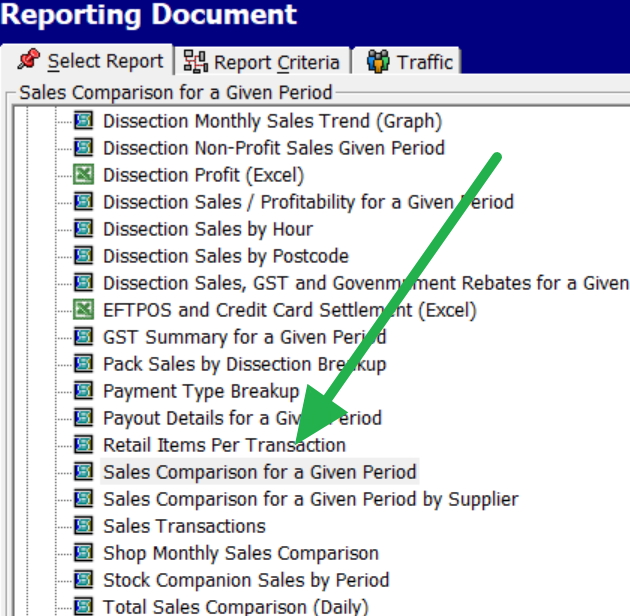
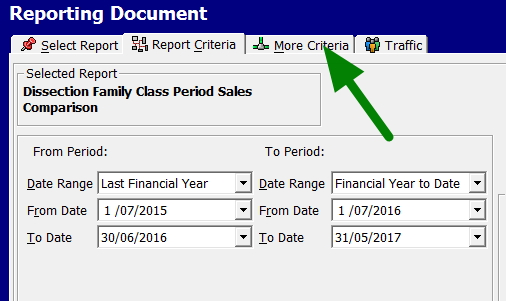
Export relevant reports from your POS system in a format your AI tool can process. Depending on what tool you use, you need CSV or Excel. I prefer Excel but its your call. Check first that your data is clean and good. If you feed the AI rubbish, you will get rubbish back.
Ask Specific Questions
Frame your queries in specific, actionable terms rather than general requests. Instead of asking the AI to "Analyse my stock," try something more targeted, such as "Which product categories show seasonal patterns, and when should I increase inventory for winter?" Similarly, rather than requesting the AI to "Check my finances," ask, "Are there any unusual expense patterns compared to last year, and which categories show the largest percentage increases?" Specific questions yield specific, actionable answers.
We found that general queries often provided incorrect answers, requiring multiple attempts to obtain a satisfactory response.
Implement Findings Systematically
Test your questions systematically and record the question that yields the answers you want. This systematic approach ensures that AI becomes a valuable part of your business improvement cycle rather than just an interesting experiment.
Focus on applying insights
The best analysis is useless if it is not applied. Each of your analysis sessions should end with clear action items to be implemented and tracked.
Recommendations for Australian Retailers
Based on comprehensive testing and practical retail experience, here are my specific recommendations for retailers looking to leverage free AI tools:
Use Grok 3 as your primary analysis tool. I am told it will soon be charged, but now it appears to be the best in the free AI market. We were impressed with its ability to handle complex questions and our interactive questions, which is excellent if, like me, you like following your natural curiosity.
"A good question in business does not lead to an end; a good question opens doors you never knew existed."
Consider using Qwen; it's excellent. We found it helpful as it gave a good second opinion. It can be especially valuable when making significant business decisions.
If you're currently using ChatGPT or Claude, be aware of their significant limitations for business analysis. Their credit restrictions make them impractical for the iterative analysis that delivers real value. You may find yourself frustrated when analysis suddenly stops.
Conclusion: The Future of Retail Intelligence
Retailers, rather than using intuition alone, can use the Free AI tools now available to gain insights.
Written by:

Bernard Zimmermann is the founding director at POS Solutions, a leading point-of-sale system company with 45 years of industry experience. He consults to various organisations, from small businesses to large retailers and government institutions. Bernard is passionate about helping companies optimise their operations through innovative POS technology and enabling seamless customer experiences through effective software solutions.
