Point of Sale Software

Here are some Articles from the Blog Subject - Point of sale management -

What suppliers do you do business and which you don't.

POS SOFTWARE

People if you are close often, as a retailer in a shop lose sight of the big picture and stare at the details. It is easy to do.

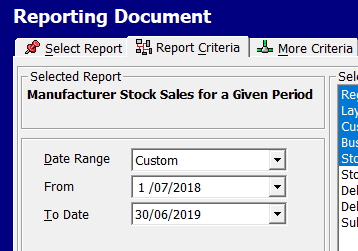
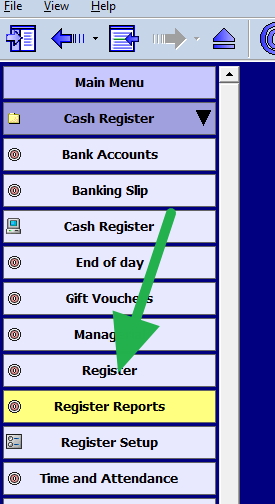
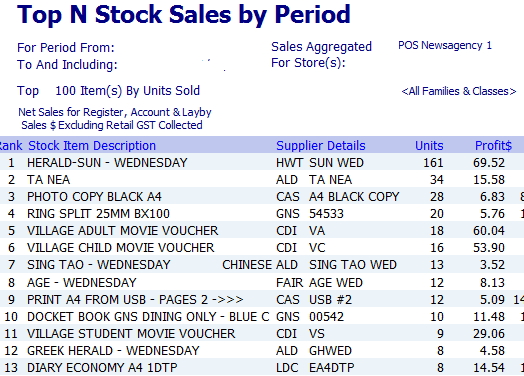
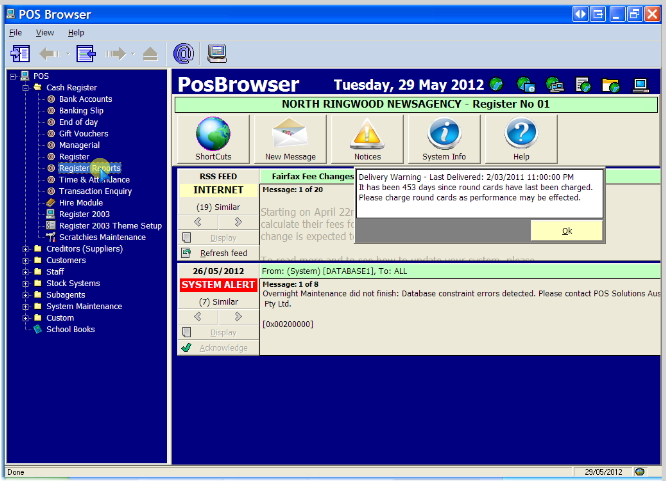
Here is a quick report that can instantly show you what people/companies are essential in your business. In register reports go to > stock sales. Now you will find the following report

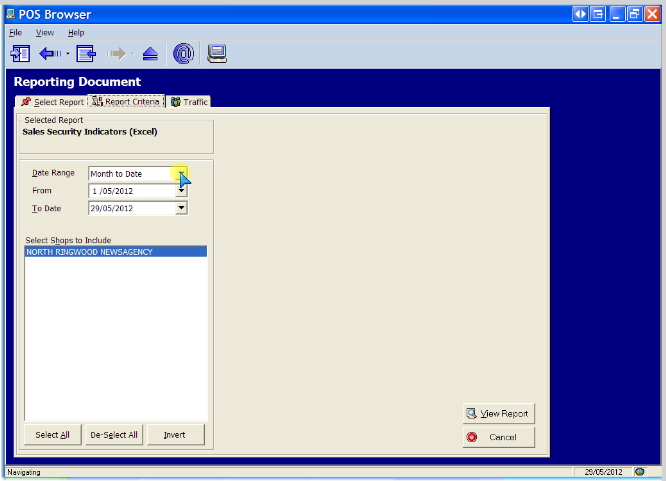
Click on it. Now although there is a lot of options here, let us make it simple and just put in last financial year

Now, will pop out a report showing which suppliers contributed the most to your business. Often they stand out as it is not uncommon nowadays for two or three suppliers to give you 80% to 90% of your business. I suggest the figures you concentrate are the number of sales and profit. The number will show why people are coming into the store and the profit will tell you where the money is being made.

An interesting exercise here is after studying this report say to yourself "I am a ..... seller"

Add new comment

Restricted HTML

  • Allowed HTML tags: <a href hreflang> <em> <strong> <cite> <blockquote cite> <code> <ul type> <ol start type> <li> <dl> <dt> <dd> <h2 id> <h3 id> <h4 id> <h5 id> <h6 id>
  • Lines and paragraphs break automatically.
  • Web page addresses and email addresses turn into links automatically.
CAPTCHA This question is for testing whether or not you are a human visitor and to prevent automated spam submissions. Image CAPTCHA
Enter the characters shown in the image.

Buy now pay later vs credit cards

POS SOFTWARE

Right now if you go into any shopping centre, you will see almost everyone is offering a buy now pay later(BNPL) option. There is little choice for many shops as Australians are dumping credit cards and going for them. Already more than a million Australians have stopped using credit cards and are using these services. So today BNPL startups are popping up like mushrooms in Australia, and although there are plenty of players in this market already, the interest now is that CBA bank has announced that it is moving in a big way into this market and soon I am sure the other banks will also move into this market.

Although each offering of BNPL is different, I think the following is a fair comment, unlike the credit card most of the fees are paid for by the merchant, not the customer. Most merchants that use these services do so because these services do push their stores thus increasing their sales.

The other issue is that a BNPL customer if you have the right products for them, is a good customer. Here is an analysis of a zip customer 
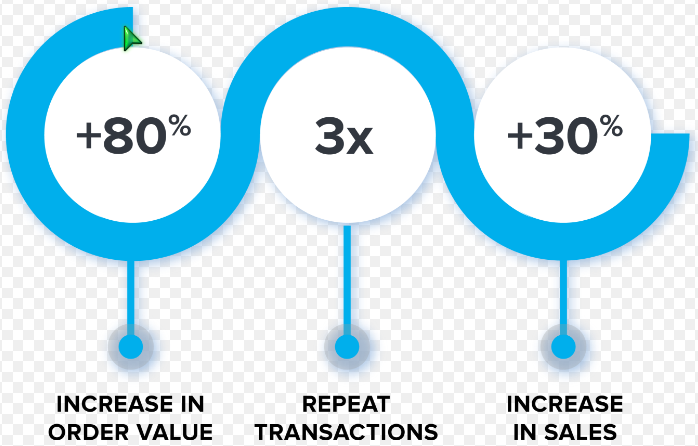


They buy more each time, and they buy more often, the operative point being here, do you have the products for these customers? 

So the big problem for many of my clients is that with credit cards whereas the fees are relatively small and can be either absorbed and/or charged to the client, with a  BNPL model, the costs are much higher, about 5% and it can be tough to charge this back to the customer as both the customers and the BNPL do not like it this chargeback. A hairdresser who was my client, charged a woman a surcharge because she used zip, the customer went on social media to complain, within hours zip picked it up the twitter and rang her and asked her to please explain. 

This leaves many of my clients with a problem, either give up a large number of clients and a major market or offer BNPL. The answer will be a decision for each store. 

If you do laybys, I do suggest that you switch at least for this service over to BNPL. If you do your sums, the extra costs and bother to you in laybys are just not worth this 5% fee.

If your layby customers do not have a BNPL account consider this when I did an experiment, I found that it took me about 2 minutes to get a BNPL account.  

Now assuming you do decide to go into this space well the question is which one do you use. Currently, there are two big ones, Afterpay and Zip. You can go for others but these two you need to look at first. Both are I think are reliable. Both run extensive marketing campaigns which do benefit the merchants that do use them. Both have a lot of followers. Generally users of these services, I find have both.

As a comparison, Zip big plus is that it lets you sell higher-priced items, its costs are a bit lower, and it pays faster. Plus it is easier to get, and they bug you less. Afterpay will put conditions on its use and in fact on all payment types that you use which blew my mind, if you have Afterpay in your shop, if you do a cash transaction you must abide by Afterpay conditions even though it has nothing to do with them. I have never seen Zip do anything like that. This is why I suggest if you are thinking of entering this market, try Zip first. Once you have bedded it down then look at others.

If you want to investigate more, click here.

PS Whatever you do, what you need to consider is that BNPL is clearly the future, soon I predict that all shops will need it.


.
 

Add new comment

Restricted HTML

  • Allowed HTML tags: <a href hreflang> <em> <strong> <cite> <blockquote cite> <code> <ul type> <ol start type> <li> <dl> <dt> <dd> <h2 id> <h3 id> <h4 id> <h5 id> <h6 id>
  • Lines and paragraphs break automatically.
  • Web page addresses and email addresses turn into links automatically.
CAPTCHA This question is for testing whether or not you are a human visitor and to prevent automated spam submissions. Image CAPTCHA
Enter the characters shown in the image.

Wasted discounts

POS SOFTWARE

Technically a wasted discount in retail is a discount that you give for an item that you would have sold without the discount because consumers would have bought the products at a total price so the discounts didn’t generate extra sales or volumes. This is a big problem in loyalty marketing as the first ones, in general, to take advantage of discounts are the regular customers the business has.

So with this in mind, a well-known management company  Nielsen Pacific, looked at the food and grocery marketing in Australia, which is worth about $51 billion a year. They estimated that about 38% of all products sold this year were discounted, and of that, about 20% of the total discounts were wasted. 

Reading their report I decided to do a calculation of the effect of discounting, particularly just how much extra one would have to sell to generate the loss of income due to the discount. Now I will do the calculation without GST as it changes nothing here.

So let us imagine you are selling 100 of a product a month at $1 with a margin of 30%. 

Turnover = $100

Cost  = $70

Profit  = $30

Now say you give a discount of 10%; what you need to do is now sell 150 products as your turnover is 150 x  $1 x (1-10%) = $135. Your cost is 150 x  $1  x (1-30%) = $105. Your profit is $135 - $105 = $30. So you have had to sell 50% more for the same profit without a discount.

In reality, you will need more as handling costs, storage costs, display costs, etc, will be more, too but let us leave that point for another day's discussion.

Now if I do the same calculation for a discount of 15%,  you have to sell 200 products or 100% more to get the same profit before the discount was issued.

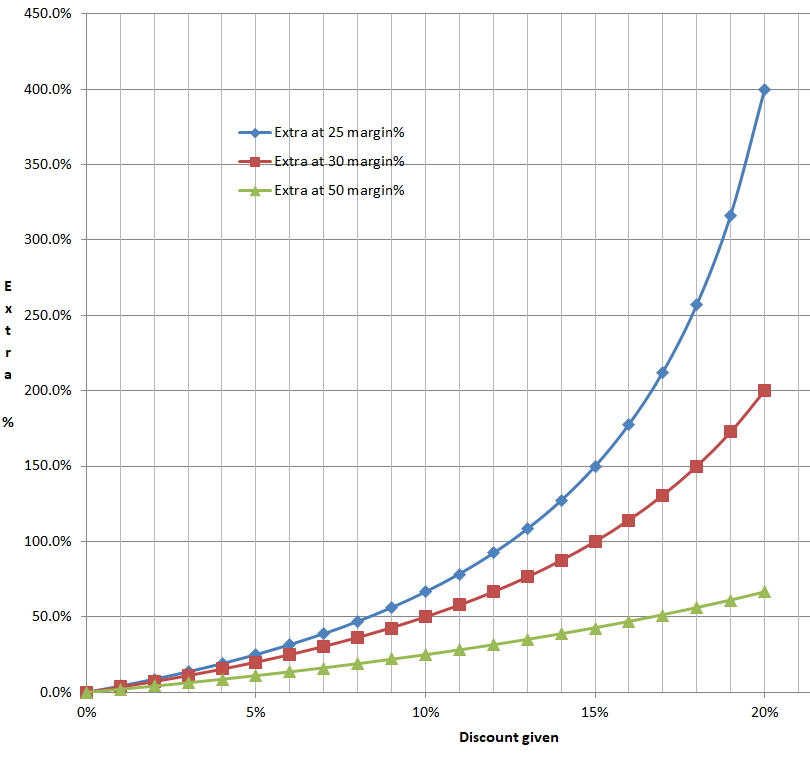
So I decided to make a graph of what it looks like, which I think you will find interesting. 


The blue line is for a product with a 25% margin, the red line is for a product with a 30% margin, and the green line is for a product with a 50% margin.

As you can see, the low-margin products are much more affected by discounting, but even here once you start hitting a 15% discount a product with a 50% margin, needs a lot more sales to justify the deduction. 

As a rule of thumb in retail, every 1% discount needs at least a 3% increase in turnover to break even.

This is why wasted discounts in loyalty marketing are a big issue.

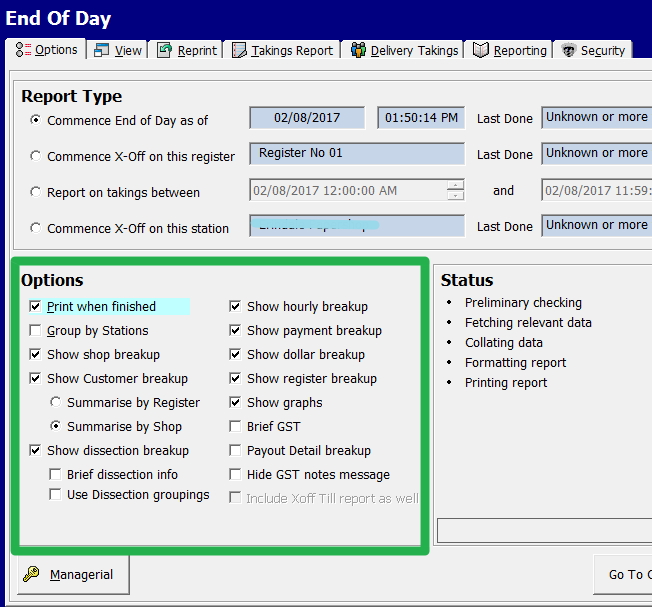
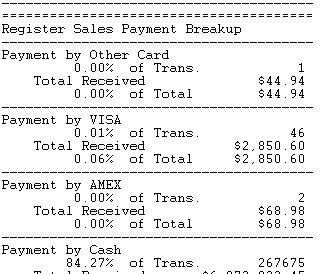
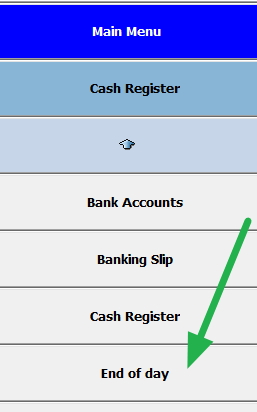
If you want to know what your discounts are, check your end-of-day reports.


Add new comment

Restricted HTML

  • Allowed HTML tags: <a href hreflang> <em> <strong> <cite> <blockquote cite> <code> <ul type> <ol start type> <li> <dl> <dt> <dd> <h2 id> <h3 id> <h4 id> <h5 id> <h6 id>
  • Lines and paragraphs break automatically.
  • Web page addresses and email addresses turn into links automatically.
CAPTCHA This question is for testing whether or not you are a human visitor and to prevent automated spam submissions. Image CAPTCHA
Enter the characters shown in the image.

Bill payments, to do or not to do?

POS SOFTWARE


The number of bill payments over the years have dropped over the counter, but it is still a big market, so many of our clients do process Bill Payments over the counter. The big plus is that it brings people into the shop. 

I would say in it promises to be a big market for the next few years. It is not just the older people, but large numbers of young and middle-aged people who pay over the counter because they can do it in cash and there are also transient people such as people who are temporary residents who have limited access to Australia's banking. These people all use phones, electricity and heating and even in this day of the internet much is paid over-the-counter.

When I did a benchmark study of our clients, I would say taking out the people that do very few, probably just their own bill payments, that left the average shop doing about 2 to 3 bill payments a day. So clearly it does bring people into the shop. How much would you pay to a Facebook consultant to get that numbers of people into your shop and buy something?

Looking at sales history, it does appear that they do buy more, although how much tends to vary a lot. 

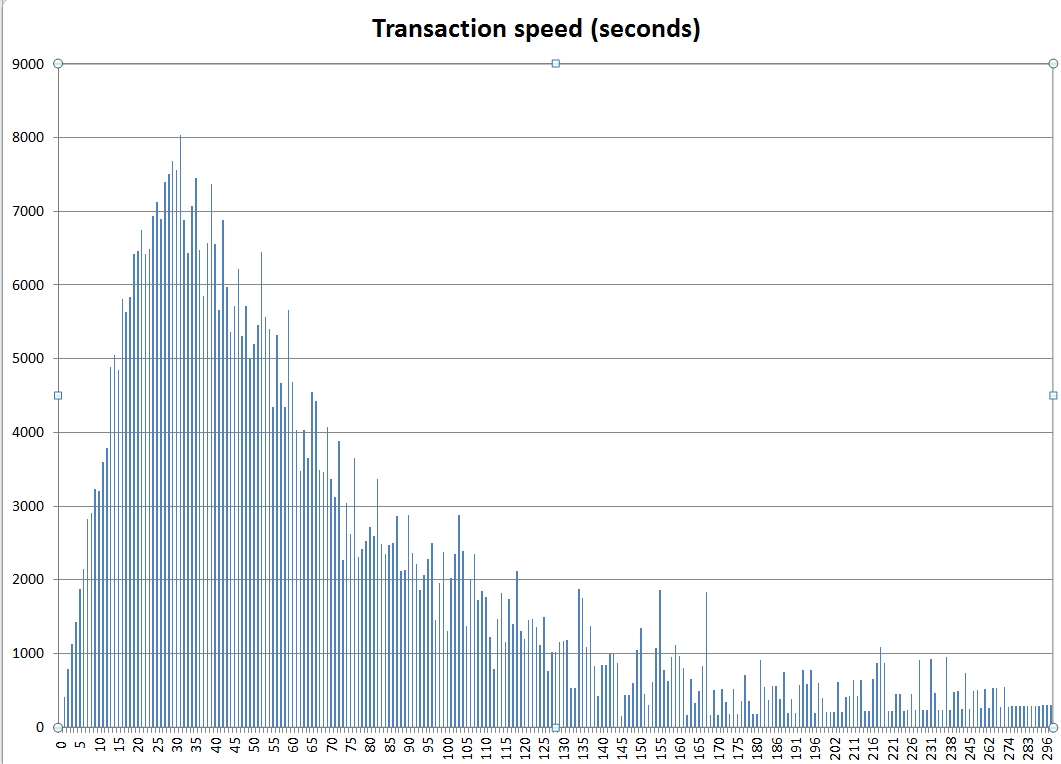
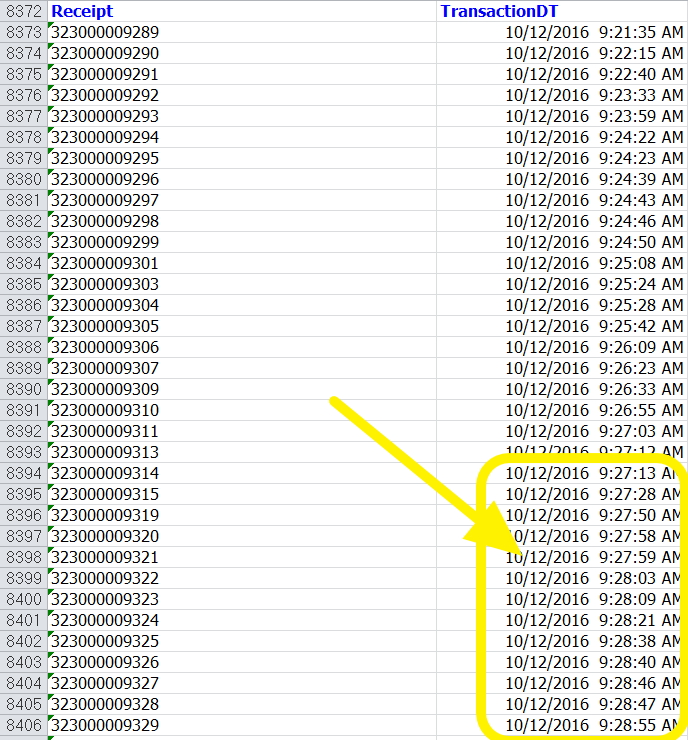
The time taken to do a transaction is minimal. My benchmark study shows what I saw seconds. 

You get paid instantly.

On the other side, quoted fees for each transaction are small, but with our system, you are under no obligation. You can charge more if you want, by introducing a service fee. No-one can stop you because we are not an agency and we are not telling you how to run your business.

Finally, there are no commitments. If it does not work for you, you can stop using it whenever you like. 

PS If you are doing Bill Payments now, contact us as far as I know our offering is best as unlike others we do not charge or take anything out of your commission. Most importantly we probably have more billers - Australian Post, for example, I saw in a post with BPAY had about 2,000 to 3,000 billers while our Bill Payments service has over 40,000 billers. From a marketing perspective, there are many advantages in this larger pool of billers as our clients as in many areas will have a monopoly on many products as they are the selling long tail and niche products. Also, in practice retailers today make most of their profits from items that few others have. Someone needs to pay an obscure bill, and they need to pay in cash, where are they going to go? They cannot go to a post office as they do not handle it. So hopefully, they will come to our client, once a month.

Add new comment

Restricted HTML

  • Allowed HTML tags: <a href hreflang> <em> <strong> <cite> <blockquote cite> <code> <ul type> <ol start type> <li> <dl> <dt> <dd> <h2 id> <h3 id> <h4 id> <h5 id> <h6 id>
  • Lines and paragraphs break automatically.
  • Web page addresses and email addresses turn into links automatically.
CAPTCHA This question is for testing whether or not you are a human visitor and to prevent automated spam submissions. Image CAPTCHA
Enter the characters shown in the image.

Warning on discounting below cost

POS SOFTWARE

Our Point of sale software can be set up to issue a special warning if a stock item being scanned price is under cost. This warns people scanning that item at the cash register that something is wrong and needs to be checked.

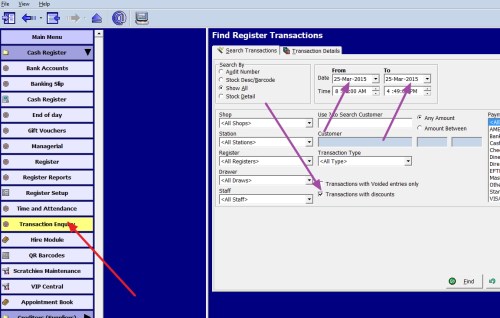
If you feel that you may have a problem here or you just want to check if you are selling too many items that are excessively large discounts,  I suggest you do is run the following report. 
 

Press transaction enquiry as highlighted in red, now select the relevant options, it actually, a good idea to do it once and then do it again with different departments that appear and check out the results.


Add new comment

Restricted HTML

  • Allowed HTML tags: <a href hreflang> <em> <strong> <cite> <blockquote cite> <code> <ul type> <ol start type> <li> <dl> <dt> <dd> <h2 id> <h3 id> <h4 id> <h5 id> <h6 id>
  • Lines and paragraphs break automatically.
  • Web page addresses and email addresses turn into links automatically.
CAPTCHA This question is for testing whether or not you are a human visitor and to prevent automated spam submissions. Image CAPTCHA
Enter the characters shown in the image.

Shop profit and sales this year to last year

POS SOFTWARE

The $64,000 question many of you will be asking now is how well did I do this year in my shop compared to last year. Just how am I travelling? 


Now is a good time to find out and it is very easy to do.


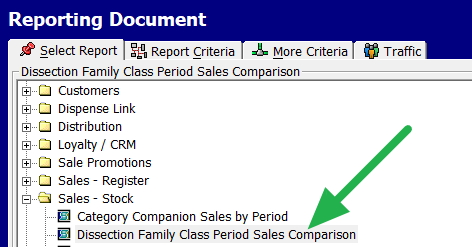
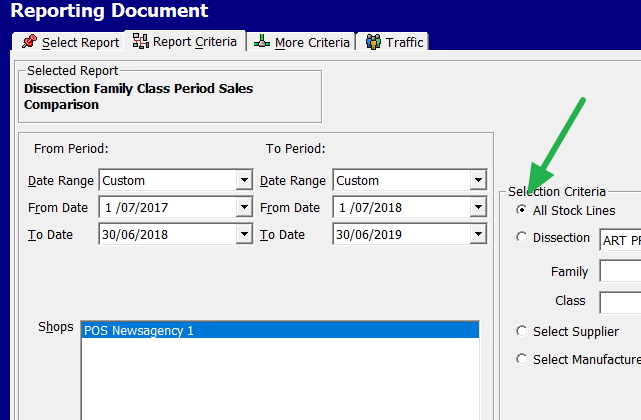
Go to Reporting Documents > Dissection Family Class Period Sales Comparison.


Now put in the financial year dates, in this case, I put down that I want a report on all products. 

Note there are many more options here but let us keep it simple, you can always experiment later if you want to learn more.


Now on the basic version, you get a very detailed comparison by department and class.  It will make I am sure fascinating reading, in my view the two most important metrics here are Qty which are the number of sales for each department and the $ Profit made by each department. 


What can be also useful is running the same report comparing last year with the year before that, this will give you a two-year trend analysis.


Add new comment

Restricted HTML

  • Allowed HTML tags: <a href hreflang> <em> <strong> <cite> <blockquote cite> <code> <ul type> <ol start type> <li> <dl> <dt> <dd> <h2 id> <h3 id> <h4 id> <h5 id> <h6 id>
  • Lines and paragraphs break automatically.
  • Web page addresses and email addresses turn into links automatically.
CAPTCHA This question is for testing whether or not you are a human visitor and to prevent automated spam submissions. Image CAPTCHA
Enter the characters shown in the image.

Slow-moving stock

POS SOFTWARE

Stock planning in retail is tricky. What you do not want is a shop full of slow-moving stock, you need stuff that sells! Besides the problem that this stock is taking up space and capital, it is also not bringing in customers.

There are several ways to identify what is your slow-moving stock, but as a rule, a stock item that sells under $100/year is slow-moving. The first point before you can do something is to identify all these items.

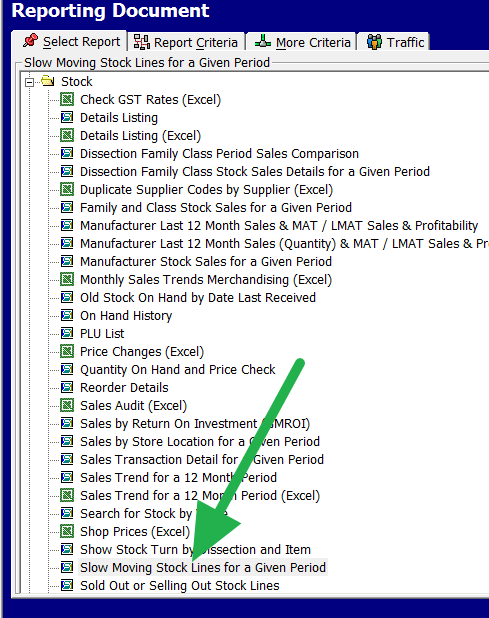
So go to Register reports > Stock > Slow moving Stock lines

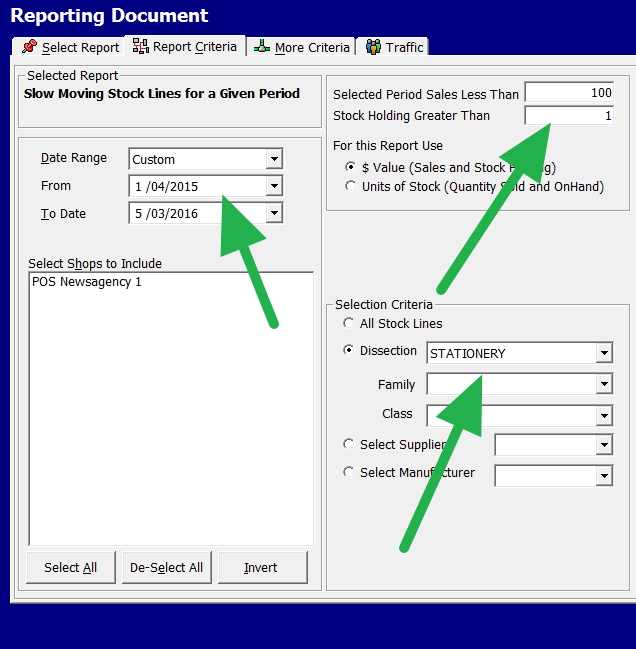
Now I put in a year of sales, and I say anything that I have stock in and have sales of less than $100. 


I find it best to work by department separately, so in this shop, I was looking at the stationery department.

Now we got a report of 81 pages of detailed information of all the items that we considered slow-moving. It totalled almost $80,000 worth of worthless stock. 

So we have someplace to start.

Such stock analysis can provide you with insights to improve your decision making that can help you reduce costs and improve sales.

Give it a try.

Add new comment

Restricted HTML

  • Allowed HTML tags: <a href hreflang> <em> <strong> <cite> <blockquote cite> <code> <ul type> <ol start type> <li> <dl> <dt> <dd> <h2 id> <h3 id> <h4 id> <h5 id> <h6 id>
  • Lines and paragraphs break automatically.
  • Web page addresses and email addresses turn into links automatically.
CAPTCHA This question is for testing whether or not you are a human visitor and to prevent automated spam submissions. Image CAPTCHA
Enter the characters shown in the image.

Calculation of Stock Shrinkage% and Damaged%

POS SOFTWARE

After you do a stocktake when you do your financial figures, you will need the following four numbers.

1) The value of your stock that your computer thinks that it had at the end of the financial year. If your point of sale is up to date, print out a report of your stock valuation before starting the stocktake. If you do not trust the figure in your point of sale software, then you can, or your accountant can give you an estimate. This is the (Perpetual stock value).

2) This comes out of your stocktake and is the value of your stock you have at the end of this financial year. Your point of sale software will have this figure once you enter in the stocktake figure in the stock valuation report. (Physically Counted Inventory Value)

3) What is the total sales of your shop less the non-stock items, e.g. if you sell touch gift cards, these are not stock items so take them off your overall sales figure.  Your total report should be able to give you this figure which is your (Sales of stock product)

4) Value of the damaged goods you counted. (Damaged stock value)

Now please do the following calculation.

Shrinkage% = ((Perpetual stock value)-(Physically Counted Inventory Value))/(Sales of stock product) x 100%

A typical figure here is about 1.4%, but it does vary a lot. I have seen estimates between 0.1% and 6%. 

Now what you may also want to look at is your damaged goods, these have a different story and it can be an exciting story to tell.

Damaged% = (Damaged stock value)/(Sales of stock product) x 100%

Once you get these figures, please let me know as I am interested in this sort of stuff.


Add new comment

Restricted HTML

  • Allowed HTML tags: <a href hreflang> <em> <strong> <cite> <blockquote cite> <code> <ul type> <ol start type> <li> <dl> <dt> <dd> <h2 id> <h3 id> <h4 id> <h5 id> <h6 id>
  • Lines and paragraphs break automatically.
  • Web page addresses and email addresses turn into links automatically.
CAPTCHA This question is for testing whether or not you are a human visitor and to prevent automated spam submissions. Image CAPTCHA
Enter the characters shown in the image.

Multi cash draws

POS SOFTWARE

Here are tips for queue handling. 

1)  When managing your store’s queue, it is important to influence your customers’ perception of their waiting. Studies show some of the problems can be alleviated by reducing the boredom, can you do something to keep them entertained? 

2) When the queues start to get really big, here is a tip, use a function in our point of sale software which allows one computer to run multiple cash draws. It is best to be prepared by having your extra cash draw ready to go but in a pinch, you can always move the cash draw itself from a non-busy area to a busy area. Now when the lines start to bank up you or your employees only need to switch on the cash drawer and start serving your customers.

3) I would suggest that you set up a policy that if say more then four people are lined up, activate a queue line and make sure that the people waiting are notified that you are trying to serve them and make a new queue. Now, this is an interesting study done in the TV show myth busters episode 242 which you may want to consider, what myth busters did was examine whether one long queue is more effective than several and what did people think. 

In a grocery store, the best way to move customers through a series of checkout counters is to have one long line and route each customer to the next available checkout.

BUSTED

Adam and Jamie set up a mock-store in an empty hangar, with fully stocked shelves and 5 checkout counters manned by experienced cashiers. Upon entering the store, each of 90 volunteers selected a specified number of items and recorded the time when they queued and the time when they reached a checkout counter. For additional realism, a percentage of shoppers were instructed to slow things down by asking for a price check or by paying with a personal check. After checking out, the volunteers would indicate their overall satisfaction with the experience.

In the initial test, the volunteer shoppers were free to choose their own checkout counter and queue behind it. The average wait time using this method was 5:39 and the average satisfaction rating was 3.48 out of 5. In the second test, shoppers were guided through a single serpentine line and then directed to the next available checkout counter. The average wait time using this method was higher at 6:56 but the spread between minimum and maximum times was tighter. The average satisfaction increased to 3.80 with the single-line method due to it being regarded as fairer. Adam and Jamie judged the myth as busted based on average time, but also called the single-line method better based on customer satisfaction.


Add new comment

Restricted HTML

  • Allowed HTML tags: <a href hreflang> <em> <strong> <cite> <blockquote cite> <code> <ul type> <ol start type> <li> <dl> <dt> <dd> <h2 id> <h3 id> <h4 id> <h5 id> <h6 id>
  • Lines and paragraphs break automatically.
  • Web page addresses and email addresses turn into links automatically.
CAPTCHA This question is for testing whether or not you are a human visitor and to prevent automated spam submissions. Image CAPTCHA
Enter the characters shown in the image.

How Did You Find Us?

POS SOFTWARE

How did you find us?

This is a handy function in our software and easy to set up. We are now doing some enhancements to it.

What is beneficial information is to find out and then record how did a person come to find your business? This can help, among other things with your marketing, deciding on your new physical location, etc. 

What you are trying to do here is know from the source of how did your customers found out about you and what led them to your shop. Once you have this you also need to consider what sort of customer each of these sources are giving you e.g. say a customer came to your shop as you have a dry cleaning drop off service, now its a question not only what is the dry cleaning worth to you but also what else has this customer purchased off you. So you may want to create a category here for how did you find us which is "dry cleaning drop off". 

If you are going to do this, you need to do is ask when interacting with your customers this question. Although often you can guess. If the first purchase of your client is the dry cleaning drop off, it is a reasonable assumption its the "dry cleaning drop off".

Currently, you can get figures and trends.

The new enhanced reports will give you more options to select from and better analysis of your lead sources. This can help you by getting higher profits and more clients.

Add new comment

Restricted HTML

  • Allowed HTML tags: <a href hreflang> <em> <strong> <cite> <blockquote cite> <code> <ul type> <ol start type> <li> <dl> <dt> <dd> <h2 id> <h3 id> <h4 id> <h5 id> <h6 id>
  • Lines and paragraphs break automatically.
  • Web page addresses and email addresses turn into links automatically.
CAPTCHA This question is for testing whether or not you are a human visitor and to prevent automated spam submissions. Image CAPTCHA
Enter the characters shown in the image.

Psychology with price labels

POS SOFTWARE

Jurek Leon is an Australian consultant in retail. He certainly knows his stuff, often talks on TV and puts out an excellent monthly newsletter for retailers which I recommend you subscribe too [Website removed] here.

His current edition has a fascinating post. 

Say we have an item in your shop which was $9, now maybe you buy a whole lot at a low price or perhaps you want to get rid of them, so you decide to reduce the amount to $5.99. Note like many good retailers you are not going at $6, but $5.99 plus you are not going to say 33% off because you know that dollar amount discounts work better than percentage discounts.

So you make a label to sell them and say you have these two options.

Two price labels compared

Option A: The reduced price is shown in big letters

Option B: The old price is shown in big letters.

Now, have a good look and decide which one is better?

Please, after you have worked out which one is better and decide why you think its better scroll down to the answer below. 

----------------------------------------------------------------------------------------------


..

..

..

..

..

..

..

..

Most people go for the first one, I did too as its the new price I want people to see, but studies show that it Option B that works better.  Why? Well according to the study. 

"It’s because the discounted price is literally smaller than the original. Behavioural economists like Bri Williams call this the ‘size-congruency effect’. She says you are better to go with your marked down price in smaller font (Option B) than the conventional stand out (Option A), proving yet again that our assumptions about how best to influence customers can often be incorrect."

This is an example to her that retailers need to test and measure results. I agree with that too, how else are you going to find what works best with your business.


Add new comment

Restricted HTML

  • Allowed HTML tags: <a href hreflang> <em> <strong> <cite> <blockquote cite> <code> <ul type> <ol start type> <li> <dl> <dt> <dd> <h2 id> <h3 id> <h4 id> <h5 id> <h6 id>
  • Lines and paragraphs break automatically.
  • Web page addresses and email addresses turn into links automatically.
CAPTCHA This question is for testing whether or not you are a human visitor and to prevent automated spam submissions. Image CAPTCHA
Enter the characters shown in the image.

Alipay now available

POS SOFTWARE

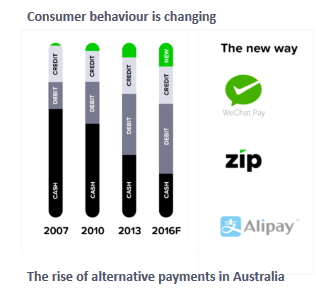
What they are doing now more are paying by debit card and the new alternative methods. Of the alternative methods, the fastest growing is Alipay. Although I have no current figures, about a year ago in 2018 10,000 merchants around Australia were offering Alipay as a payment method. 

What has been happening is that consumers in Australia have been rapidly changing from cash to other forms of payments. 

Payment_method

Look at the alternative payment figures, Alipay it is the fastest growing segment in this category. What Alipay is, is the largest online payment platform in China. It has been snowballing in China for years and now is the preferred payment method for Chinese students and tourist in Australia.

Itwire studies have shown that  99% of Chinese tourists in Australia have Alipay.  In 2018, Alipay transaction volume in Australia increased by 110% and using Alipay the amount spent per person was up by 40% and its a wide range of products that they buy here.

The Alipay fees are comparable to many VISA and Mastercard transactions now, and there is no cost to switch on so for our clients, I cannot see it as anything else but a no-brainer to try it out.

So we are pleased that we are offering a direct integration of Alipay. It will work through Tyro EFTPOS which as Tyro has no fees or contracts, so it is easy for any of our clients to add this payment type if they want it. If you are interested, let me know.


Add new comment

Restricted HTML

  • Allowed HTML tags: <a href hreflang> <em> <strong> <cite> <blockquote cite> <code> <ul type> <ol start type> <li> <dl> <dt> <dd> <h2 id> <h3 id> <h4 id> <h5 id> <h6 id>
  • Lines and paragraphs break automatically.
  • Web page addresses and email addresses turn into links automatically.
CAPTCHA This question is for testing whether or not you are a human visitor and to prevent automated spam submissions. Image CAPTCHA
Enter the characters shown in the image.

Backing Up To Cloud

POS SOFTWARE

Cloud_point_of_sale.jpg


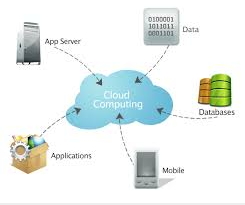
What it enables you to do is backing up your data, to an online storage service. Popular services include Dropbox, OneDrive (which is my favourite) and Google Drive.

When I first started talking about low-cost or free online backup for point of sale available, many of my competitors were negative. I suspect as they wanted to sell the dearer one. 

Today almost all my clients use such a service, and most of my competitors offer such services in their software. 

Some of the pluses would be 

  • Your backup can be largely automated.
  • It is safer as it is off-site so even if the shop burnt down and every backup was lost; you would still have a copy.
  • Data can be easily transported from one computer to another say at home.

However, we recommend all our clients use cloud back up *ONLY* as a secondary and last emergency service as some of the minuses would be 

  • Online storage services sometimes do lose data, do not believe just because Microsoft has your data that it is safe. One of my clients lost most of their backups when one staff left and removed the store's Microsoft 365 licence from her home computer. You still need to watch it.
  • It can take a long time to do the backup. A 1.5 Gigabyte point of sale date file at 512 Kps (which is a good rate) will take about 7 hours. While it is happening, your internet will slow down dramatically. 
  • People tend to take it for granted once it is back up to the online site that it is okay. Not necessarily. I have seen corrupt backups from the cloud. The data can be faulty just like any other backup system. The backups still need to be checked.
  • The free cloud services probably will not provide you with an automated solution from what is today a significant problem - ransomware attacks.  


Comments

Keeping aside a few bad experiences and errors it has always been a smooth experience for me and my company while backing data on cloud. It saves you the unnecessary hardware and gives a sense of security that the data is in safe hands. I have been using cloud for a long time now. Giving commands over the cloud to my Fuji Xerox C2270 is something that has made my life easy as I can provide my staff with the necessary documents for approvals.

Sam, we do it too, but we use gmail. The big pluses are that anyone with access to that gmail can access the documents, saves people having to go to the filing room and look plus we get a search facility in the cloud.

Add new comment

Restricted HTML

  • Allowed HTML tags: <a href hreflang> <em> <strong> <cite> <blockquote cite> <code> <ul type> <ol start type> <li> <dl> <dt> <dd> <h2 id> <h3 id> <h4 id> <h5 id> <h6 id>
  • Lines and paragraphs break automatically.
  • Web page addresses and email addresses turn into links automatically.
CAPTCHA This question is for testing whether or not you are a human visitor and to prevent automated spam submissions. Image CAPTCHA
Enter the characters shown in the image.

Too much excessive discounting

POS SOFTWARE

Sale by discounting

One trap that many retailers fall into is discounting too much to sell product. In my experience retailers often start the discounting to maintain sales levels when the items sales performance drops. Unfortunately, the increase in sales volume produced by discounting is not enough to maintain profits but it can be misleading as it looks like it is selling well. As this continues after a while, there is a real danger to the business. 

We have a terrific report that can alert you to this problem early.

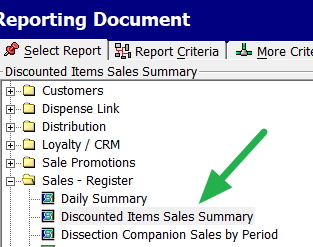
In the reports,> Go to Discounted Items Sales Summary 

It is shown marked with a green arrow below.

Discount menu item

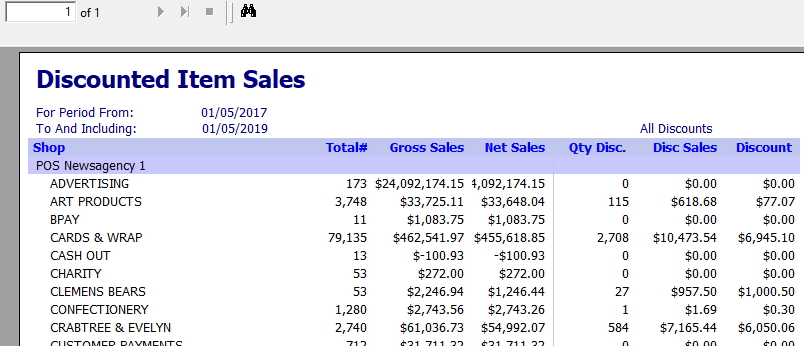
Fill in the appropriate responses and here is the basic report that appears.


Discount report

What it is showing is sales and most importantly for this question here the selling discount history. 

Note the large discount that had to be given to the Clemens Bears here to sell them. 


Add new comment

Restricted HTML

  • Allowed HTML tags: <a href hreflang> <em> <strong> <cite> <blockquote cite> <code> <ul type> <ol start type> <li> <dl> <dt> <dd> <h2 id> <h3 id> <h4 id> <h5 id> <h6 id>
  • Lines and paragraphs break automatically.
  • Web page addresses and email addresses turn into links automatically.
CAPTCHA This question is for testing whether or not you are a human visitor and to prevent automated spam submissions. Image CAPTCHA
Enter the characters shown in the image.

Short term Product Placement 

POS SOFTWARE

As a rule, top-selling items should be at eye level in the shop in the highest selling areas. This helps to encourage even more sales. The problem is that many items are only short-term sellers and are difficult to identify. For example, I am sure over the next three weeks, Game of Throne products will sell well but once the series is over product sales of these items will fall off.

And they do fall off, for example, our research shows that in most shops, that six out of the top ten sellers today will be in the top ten sellers list tomorrow. You better have a look at those items today and be aware that almost half will experience dramatic falls in sales tomorrow. 

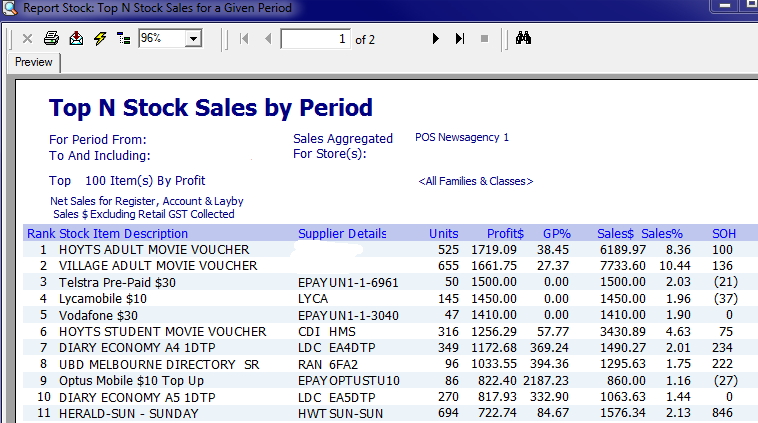
This is how you analyse your POS software information so you can determine which items are selling the most in the short-term. 


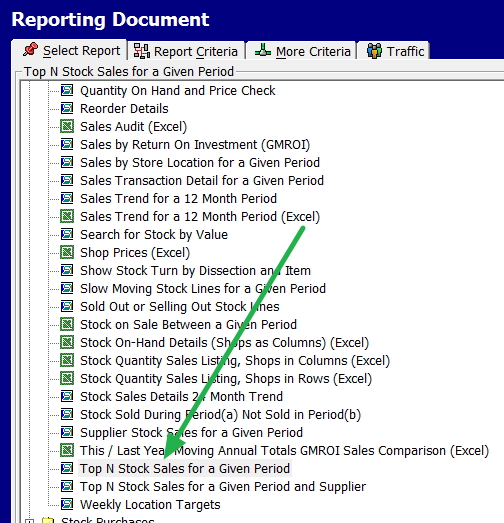
Go to Register reports

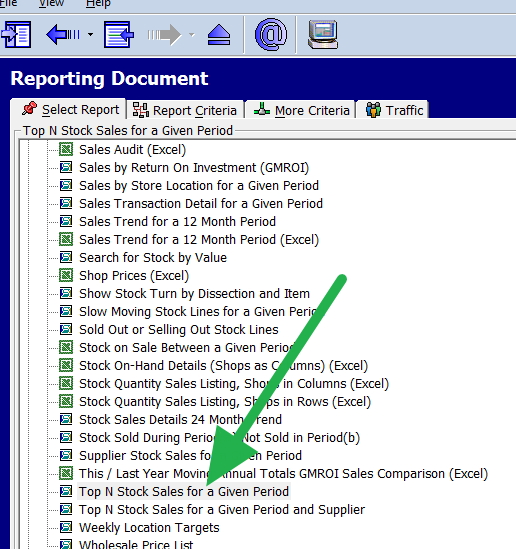
Now select "Top N Stock Sales for a Given Period"


Now put in yesterday dates and out comes a report with the top sellers for today.

Now, these need to be checked that they are in the highest selling areas in the shop.

Tips for placing top-sellers

Shoppers start looking at a shelf at eye level and they look from left to right, so what you want to make sure is that your high selling products in the shelf are on the left at eye level. 

Think of placing complimentary goods near your best sellers to grow basket size and drive impulse purchases. This product strategy works well as people once they decide to buy something will often buy more. 

All things being equal, give preference to brand and quality items. For some reasons which I am not sure, these do better and they give your shop a boost as it is seen as a quality shop. Let the bargain shoppers work a bit harder in your shop for their bargains.


Comments

Thanks for this post.Top N stock sales by period want more details?

Add new comment

Restricted HTML

  • Allowed HTML tags: <a href hreflang> <em> <strong> <cite> <blockquote cite> <code> <ul type> <ol start type> <li> <dl> <dt> <dd> <h2 id> <h3 id> <h4 id> <h5 id> <h6 id>
  • Lines and paragraphs break automatically.
  • Web page addresses and email addresses turn into links automatically.
CAPTCHA This question is for testing whether or not you are a human visitor and to prevent automated spam submissions. Image CAPTCHA
Enter the characters shown in the image.

Your sales security indicators

POS SOFTWARE

Because retailers often have multiple cashiers at the register, the POS system, a retailer needs each operator their own user profiles so tracking individual sales and monitoring sales goals becomes possible. If you give each operator their own till then all the operator needs to do is log in at the start of their till and balance at the end. Otherwise, each operator should be logging in with each new sale.

Now once that is done you can use your sales security indicators. What these indicators do is gives you a detailed breakdown for each operator on no sale, voids, count, totals, refunds, negative items and discounts. What you are doing here is looking for something that an operator is doing unusual. For example, one operator is doing a lot more nosales than anyone else.

It is easy to do.

Go to cash register reports

posbrowser menu

Open Staff and click on "Sales security indicators"

Website under attack sample log file

Select the required period, in this case, the last twelve months.

Sales security indicators

See how you go.

The report comes out in excel so you can edit it.

Add new comment

Restricted HTML

  • Allowed HTML tags: <a href hreflang> <em> <strong> <cite> <blockquote cite> <code> <ul type> <ol start type> <li> <dl> <dt> <dd> <h2 id> <h3 id> <h4 id> <h5 id> <h6 id>
  • Lines and paragraphs break automatically.
  • Web page addresses and email addresses turn into links automatically.
CAPTCHA This question is for testing whether or not you are a human visitor and to prevent automated spam submissions. Image CAPTCHA
Enter the characters shown in the image.

Large cameras on the tills

POS SOFTWARE

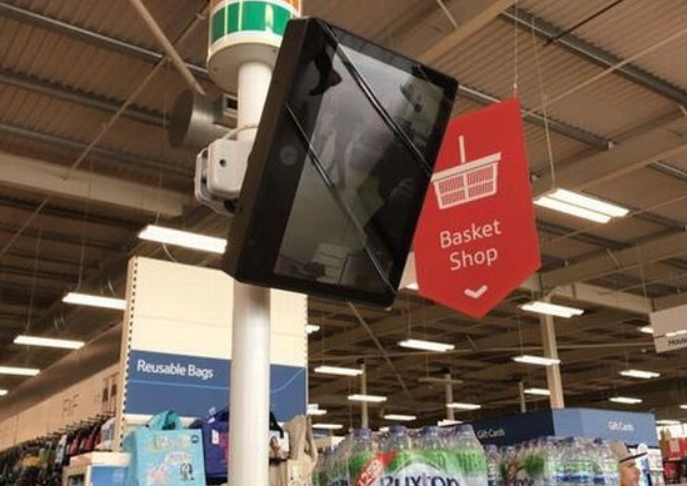
 Woolworths is now following Coles’ lead in installing large security cameras and screens on the top of self-serve checkouts.

This is being done worldwide. Here is a picture of Tesco, a large chain in the UK doing it too.

Camera over a till

The public does not like it, but there is no choice. Shoplifting is now such a big problem. The figures quoted for Australia range from about 1.3% to 3% of retail sales depending on who you talk too. Among my clients, I have seen numbers when we calculate it between less than 1% to over 4%. The 4% guys did not last very long. 

If you want to know how to calculate your figures, I have written here a step by step approach.  Using this approach in less than an hour, you should be able to get a pretty good feel of what size of a problem you have. If you cannot use current figures, use last financial year and do not be too concerned if some values are a guess. In my experience as long as you are reasonably sure, it should be good enough to give you a decent feel. Trust me, doing nothing and being ignorant of the figure is not better.

I would also recommend that you seriously consider following Coles and Woolworth's lead in putting up such large security screens.

Add new comment

Restricted HTML

  • Allowed HTML tags: <a href hreflang> <em> <strong> <cite> <blockquote cite> <code> <ul type> <ol start type> <li> <dl> <dt> <dd> <h2 id> <h3 id> <h4 id> <h5 id> <h6 id>
  • Lines and paragraphs break automatically.
  • Web page addresses and email addresses turn into links automatically.
CAPTCHA This question is for testing whether or not you are a human visitor and to prevent automated spam submissions. Image CAPTCHA
Enter the characters shown in the image.

Use technology to use Your Shelf Space Effectively

POS SOFTWARE

What retailers need to do is identify the stock that their customers want and can see when they come into the shop.

If the customer does not see it, then many will not buy it.

What you need is your hot stock in a prominent display that shows off this product so that your customers know exactly where to go to find it.

Let us find them  

Go to your cash register reports


Select Top N Stock sales for a given period

Now select a reasonable and ask for a report by profit.


This gives you a list of your most profitable items.

Check stock levels

Now, the first point is to look through the list to make sure that you have sufficient stock on hand (SOH). The big question here is do you have highly profitable items but no stock?

Review items

Check these items to see what makes them so great, could be the position or is it the item. Check to see if they are in the best position? Are they adequately displayed? Maybe they should be in more than one location. As a rule double the size of the display in retail is said to increase sales by 50%. A good item with double the display will probably sell more than a good stock and a marginal one. 

Another possibility is to make them a bit more noticeable to your shoppers by moving them at the entrance or the checkout counter, where they can produce more.   

Position stock

Now start rearranging. The most profitable items should be front and noticeable.

Try it out

Dramatic improvements in sales can be made by using technology to improve your performance.

Promotion ID

POS SOFTWARE

John Wanamaker is credited with the saying that "Half the money, I spend advertising is wasted; the trouble is I don't know which half".

This is a common problem in business. We go to a lot of trouble and money making some advertisements. We sell some goods now the question asked is did the advertisements have much to do with it? It can be very hard to tell.

For example, I have a client that sells about 12 of an item a week but sales from what we can see regularly range from 10 to 20 every week. There was a big promotion on the goods, they got into the spirit of things by doing a display, and they sold about 18 items. This is well over average but based on this it is difficult to determine whether the promotion and their presentation helped or not. See they had weeks when they sold more without doing anything.

One practical tip is to try to measure as much as possible the success of a promotion.

For example in the advertisement put in a rarely used phone number and/or email address. For example both Outlook.com and Gmail support disposable addresses without needing to register them first which is perfect for this work. Another tip which often works well is to ask people. 

Often all people want is an idea, that some interest was generated. 

The next point is that if you know that they did respond to your promotion how do you mark it into your system. Our point of sale software has a very advanced system for doing this. What you need to do is enter into the POS system a Promotion ID.

Firstly you need a Promotion ID here are some tips:

- Make a unique ID for each different promotion. This will allow you to distinguish each promotion. Don’t reuse or recycle these IDs for different promotions. If you feel you must use the same ID  add a date or year after it, eg add Feb2019, if it ran in Feb 2019.  

- Once you make an ID, don't change it. 

- Do not use spaces, it can be confusing, e.g. a person was looking at Jan  2019, and it sometimes worked, and sometimes it did not. What we found was the ID was Jan 2019 (One space no, two spaces which he sometimes used)

Now go here to Detailed Transaction Entry see red arrow, click on the image below for more details.

Purchase Order Numbers

Now you see the Promotion ID. 

Enter the appropriate code when putting in the sales.

Now you can monitor the transactions. This may help you to alleviate the nagging feeling in the back of your mind over whether you are getting value for your advertising

Comments

A phone number works well, the problem we have is that the phone is in the wrong place.

Nice idea, I used it on a promo that I made up for the Melbourne cup day and it worked well.

Analysing your customers

POS SOFTWARE

Customer reports

In your point of sale software in the menu, you will find a series of reports under the heading Customers. 

Now start dividing your customers into four groups.

I recommend that you go through these to find the one that you like. At the very least generate a “sales by customer” report. This will allow you to identify your top customers as well as those who are not engaging with you.

The next point to do is to look at the profits you are making from your customers.

Customer turnover vs profit

Those with low turnover you do not see much so there is little you can do here with them in the short term, so the analysis concentrates on those with the high turnover.

For this analysis, the ones you are most interested in are those circled in green, the ones that are a low profit but have a significant turnover with you. If you think about it those in the green circle, you see regularly, but they are not worth much to you. Generally, its because they are buying low margin items. 

These people are prepared to spend money in your shop which is positive, but the challenge here is to get them to buy higher margin items. 

Is your product mix correct for these people? What do they want?


Comments

Add new comment

Restricted HTML

  • Allowed HTML tags: <a href hreflang> <em> <strong> <cite> <blockquote cite> <code> <ul type> <ol start type> <li> <dl> <dt> <dd> <h2 id> <h3 id> <h4 id> <h5 id> <h6 id>
  • Lines and paragraphs break automatically.
  • Web page addresses and email addresses turn into links automatically.
CAPTCHA This question is for testing whether or not you are a human visitor and to prevent automated spam submissions. Image CAPTCHA
Enter the characters shown in the image.