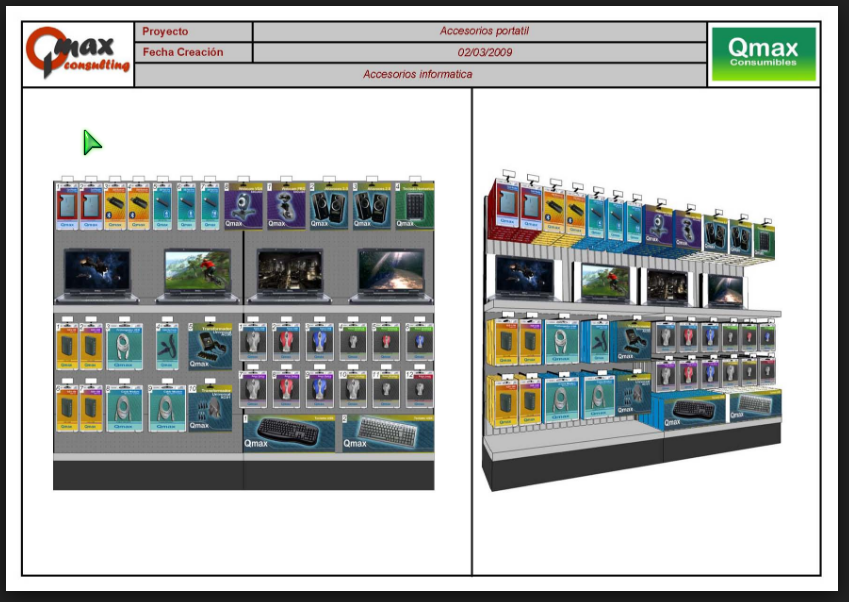
A planogram is a diagram that indicates the placement of retail products on shelves to maximise sales.
It does not have to be rocket science, here are two planograms, the top one will cost you nothing to make and will take you once you age organised less than an hour, details here and here.
![]()
And this one will cost you thousands, see details here.

Of course, the first does not do as much as the second but as we say "we get what we pay for." The ability to do product placement is minimal in the first one. Still, it is better than nothing.
Budget
My clients widely use planograms before they do a shop fit. However, some of my clients do it regularly monthly or quarterly. Two main reasons, the first is that it gives them more control and it does improve their sales. The figures thrown around is somewhere between 1% to 10%, most probably closer to 1%, So if you are doing a million turnover a year with an average margin of 27%, you are looking at $2,700 to $27,000 extra profit a year. This will give you as a first level approximation a rough budget. An hour a quarter can be justified.
Measuring
Keep it simple. I would suggest an SMB use three measurements
1) Number of sales per linear metre
2) Profit per linear metre
3) Shoplifting per linear metre (this you would do after a stocktake)
Finally please do not be concerned if you do not have everything right, 80% is better than nothing.


