
What you will notice is that successful companies focus on the long-term. If you think about it, there is often little you can do in the short-term. You can do more in the medium-term. You can even more in the long-term. Plus, it is the long-term where you can see the critical changes in your business environment.
I will show you here a quick and effortless way to look at your long-term trends in your shop. It will take you less than a minute to do, but I promise you that you will have many hours of thinking.
What started this off was a big discussion by newsagents on a report recently issued by Google on "Australian Media Landscape Trends" but concentrating on "What caused the decline in Australian newspaper revenues?" You can find the report here. It makes interesting reading as it is well researched. This is why everyone was so impressed with it. But, what caught most of the interest was the figure Google released on the fall of print circulation. It seems way off. In 2002, print circulation sales in this report were $1.3 billion. In 2018 it is listed as $0.8 billion. If the figure in 2002, is correct, then the figure in 2018 seems to be much too high. There may be many reasons for this apparent discrepancy. Although there is nothing in the report about it, many small businesses incurred much more significant losses due to this eg, the milk bar, newsagencies, etc. that made a living selling newspapers. A thousand newsagencies gone, and the rest have suffered significant losses in valuations. No-one is talking of compensation for them!
Anyway, what was wanted is a way of telling a small business what their figures would be. How do you get such a snap-shot of the long-term of a business?
To find out; a visual graph is the best.
Here is an example, this is a graph of newspaper sales in a newsagency from when the owners took over in 2005 to the end of this report in 31/12/2018
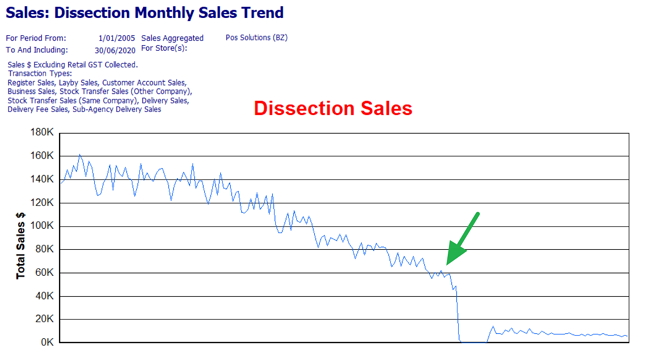
The green arrow is about when they first decided to give up newspapers. As you can see, they were large in newspapers, and their fall was much larger then what Google states. Looking at the graph, you can see that the trend down is accelerating after 2008. Soon they decided that it was not worth doing the work for sub-agencies or deliveries, so they dumped newspapers. Then they only took the newspapers back after many discussions.
It is a fascinating example, but you can do this for any dissection or product that applied to your shop. If you are doing this, I recommend working by month. It smooths out the daily sales variation but keeps the patterns. Plus, its the way most people think about their sales in monthly terms.
Go to Cash register reports> Sales > Sales dissection monthly sales trend.
Select a department, put in the dates. If you have it, look at 20 years and a few seconds to see the long-term.
See how you go and like always let me know as I am very interested in stuff like this.

