Knowing where your business is going is essential. This is afterall 2020 (20/20 vision)
Now is an appropriate time to take a quick look find how well you went in 2019 and how you compared to previous years.
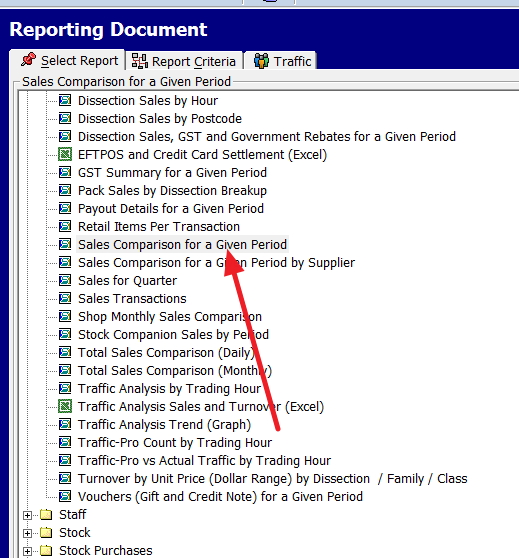
Go to register reports.

Now select the item marked "Sales Comparison for a Given period".
Note you can do it by a supplier, but that can be done later when you have more time for detailed analysis. What we are doing here is getting a quick idea.
It takes two steps.
1) Put in here the dates
01/01/2018 to 31/12/2018 AND 01/01/2019 to 31/12/2019 dates
It only takes a few seconds and out will give you pages of detailed information showing how went in 2019 and how you went compared to 2018.
Write down some key figures.eg Turnover18, Turnover19
2) Now go back in and run the report with
01/01/2016 to 31/12/2016 AND 01/01/2017 to 31/12/2017 dates
Write down some key statistics, in this example Turnover16, Turnover17
You now have four years of information to study. This should give you a pretty good idea of how your business is travelling now. I find drawing a graph of sales shows me a clear picture.I hope it went well for you.
Note if you use our Ad Hoc reporting you can automate much of your analysis, but in practice, I find keeping it simple like this seems to be more meaningful.
This is just another example of how powerful our point of sale software is for retail management.


