The 80/20 rule states about 20% of your products earn about 80% of your profits. Now everyone wants to know the 20% because that's almost all the profit.
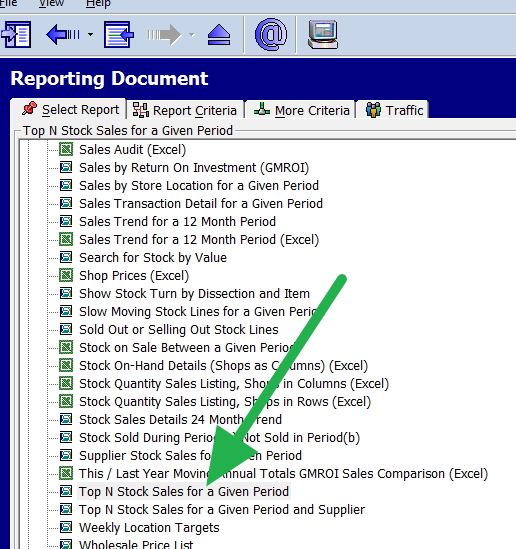
Go to stock reports > select stock N sales for the last 12 months, choose now as a number of items 30,000 as we want every item.
We recommend that you generate the report based on profit, but this will depend on your marketing strategy as many prefer quantity. Some use a combination of both, for example, a major magazine distributor network used 2/3 x (profit%)+1/3 x (turnover%).
Anyway for this exercise examine the running profit total.
Now A products will stand out. Expect you have about 100. These are your *excellent* products; we use a convention of blue to mark them.
You will then be presented with a few pages of products that more than pay their way. These are your *above average* products; we use a convention of green to mark them.
Then you will get pages of products that do pay but not well. These are your *average* products; we use a convention of Yellow to mark them.
Then you will get pages of products that barely pay for themselves. These are your *below average* products; we use a convention of Orange to mark them.
After that, you have pages of *bad* products; we use Red for them.
Then you have to ask yourself. Do you need what of these Orange and Red products do you need?
I checked one of our clients. The store has 21,000 lines in stock.
20% of profit comes from 135 products
50% of profits were made on 1,873 products
80% of the profits came from 7,374 products
You can then draw on a planogram this.
Now please do it. I am sure you will find the results helpful.


