Today, retail success depends on turning sales data into actionable business insights. Follow this guide to use tools to make data-driven decisions that significantly impact retail performance using POS Systems.
Accessing Your POS Gold Mine
Your point-of-sale (POS) system has a Gold Mine of data. Here's how to access your sales comparison reports:
- Open your POS software and navigate to the Reports section.
- Select the Sales option.
- Look for the Compare feature to analyse different periods side by side.

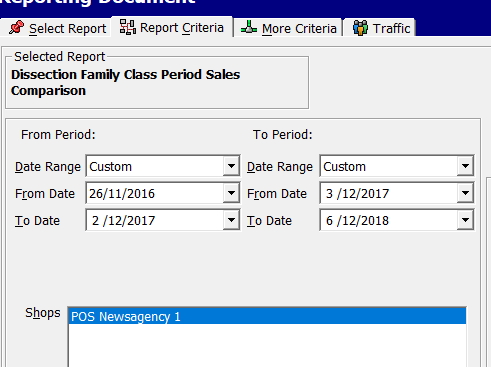
Setting Up Your Comparison: The Foundation of Insight

When setting up your comparison, you have two main options:
-
Formal Date Ranges: Use standard periods like months or quarters for consistent reporting.
-
Custom Date Ranges: Select specific dates (e.g., 06 Nov 2024 to 05 Dec 2024) for more targeted analysis.
Pro Tip: Choose comparable periods for meaningful analysis. For example, compare:
- This year's holiday season to last year's
- This quarter to the same quarter the previous year
- Weekends vs. weekdays
By selecting similar business cycles, you'll gain the most accurate insights into your performance trends.
Analysing the Report: Your Retail Crystal Ball

Your comparison report offers a wealth of information:
Overall Performance Metrics
- Sales figures for each period
- Revenue generated
- Quantity sold
Department-Specific Insights
- Performance comparisons across departments
- Individual department deep-dives
Pro Tip: To analyse specific departments more thoroughly, click on them in the left-hand menu.
Understanding POS Data Export: Unleashing the Power of Excel

To gain additional insights, export your data to Excel. Follow these steps:
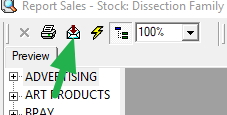
- Click the export button in the top left corner of the report.
- Choose Excel as your export format.
- Open the file in Excel or OpenOffice (a free alternative).
Once you've got your data in Excel, you can dig deeper.
Actionable Insights from Reports: Beyond Sales Comparisons
Your POS system is a goldmine of retail intelligence. Beyond sales comparisons, consider exploring these powerful reports:
- Top-selling products analysis: Identify your star performers and potential areas for expansion.
- Inventory turnover tracking: Optimise stock levels and reduce carrying costs.
- Customer purchase history: Tailor your marketing and loyalty programs for maximum impact.
- Staff performance metrics: Improve scheduling and identify training opportunities.
Turning Data into Dollars: From Insight to Action
Now that you've gathered insights from your POS reports, it's time to put them into action:
Identify top performers
Optimise the placement of your best-selling products in your store layout.
Adjust inventory
Use turnover data to fine-tune stock levels, reducing overstock and stockouts.
Refine marketing
Leverage department performance comparisons to allocate your marketing budget effectively.
To consistently enhance your retail performance, regularly examine your data, experiment with new strategies, and evaluate the outcomes.
Your Next Moves: Turning Data into Profit
Start harnessing the power of your POS data today:
- Generate a sales comparison report for the last two months.
- Identify your top three performing products or departments.
- Create one actionable strategy based on your findings.
- Execute your strategy
- Monitor the outcomes.
Your POS system can be your gateway to success in retail.
Frequently Asked Questions
Q: How do I access sales comparison reports in my POS system?
A: To access sales comparison reports:
- Open your POS software
- Navigate to the Reports section
- Select the Sales option
- Look for the Compare feature to analyze different periods side by side
Q: What types of date ranges should I use for comparisons?
A: I suggest using formal date ranges, such as monthly ones. Custom date ranges (e.g., 06 Nov 2024 to 05 Dec 2024) are for ad hoc analysis.
Q: What key information can I find in a sales comparison report?
A: Sales comparison reports typically provide:
- Overall performance metrics (sales figures, revenue, quantity sold)
- Department-specific insights
- Performance comparisons across departments
Q: How can I analyse my POS data more in-depth?
A: Export your data to Excel or a similar spreadsheet program. This allows you to perform custom calculations and create tailored data visualisations.
Q: Beyond sales comparisons, what other reports should I explore in my POS system?
A: Consider exploring reports on:
- Top-selling products
- Inventory turnover
- Customer purchase history
- Staff performance metrics
Remember, consistent analysis and action based on your POS data are key to optimizing your retail operations and boosting your bottom line.


