Making fact-based decisions is vital to maximising profitability in your shop. We will discuss how you can leverage data in your Point of Sale (POS) software to evaluate stock performance effectively. By analysing sales reports and companion sales, retailers can gain valuable insights into which products drive profitability and customer engagement.
Understanding the Dynamics of Sales and Profitability
Operating a retail business requires consideration of every kind. The main aim of decision-making is always to identify what to sell through pricing for maximum profitability. However, it goes beyond just making sales; it involves knowing how much customer behaviour affects the quantity sold and profit margins earned per unit, among other things.
Evaluating Stock Performance
Step 1: Assessing Sales Data
The journey begins with delving into your Point of Sale (POS) Software. By examining your selling reports, you gain valuable insights into how each product performs regarding sales volume and profitability. But here's where things get interesting: what if an item sells well but doesn't contribute significantly to your bottom line? This is where the pivotal question arises: Does it attract customers who purchase other items?
Step 2: Navigating through Register Reports
- Navigate to Register Reports in your POS Software.
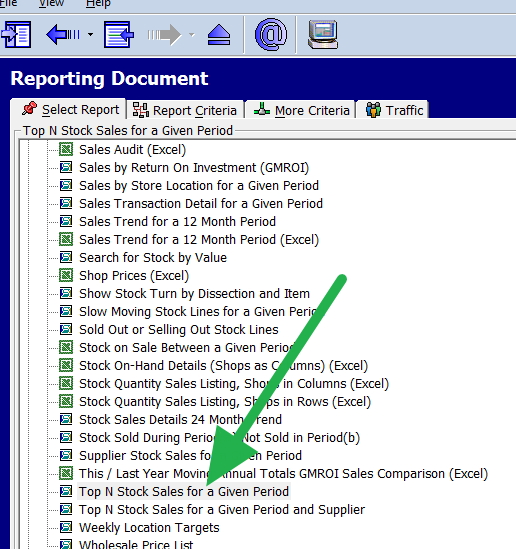
- Select "Top N Stock Sales for a Given Period."
- Input a timeframe, like a year, and request data for the top 100 items by quantity.

Deciphering the Data
Upon generating the report, you'll encounter a wealth of information.
Out comes a report with the top sellers for that year.

Let's take a closer look at this example:
| Item | Stock Ranking | Quantity Sold | Profit |
|---|---|---|---|
| ENVELOPE | 45 | 300 | $77.45 |
In contrast, the item ranked 44th above it yielded a profit of $1159. This stark contrast prompts a critical question: Is the profit from the envelope sufficient to justify its presence in your inventory?
Unraveling the Impact on Sales Companion
To delve deeper into the matter, explore the Sales Companion feature:
- Head to Reports > Sales Register > Stock Sales Companion Sales by Period.
- Specify a period, such as the last financial year, and search for the product "ENVELOPE TUDOR."
Analysing Companion Sales
The resultant report unveils a list of items sold alongside the envelope, culminating in a total profit figure. Here's where interpretation comes into play:
| Companion Sales | Total Profit |
|---|---|
| $265.01 | $265.01 |
How much of that profit of $265.01 would you have made anyway, with or without that profit? That is something you have to decide.
Additional Factors Influencing Stock Performance
Sales data analysis is essential, but there are other things that a person should consider regarding profitability and stock performance. They include:
Seasonality
Some products may have varying demand levels during different seasons.
Customer Demographics
Knowing the demographics of the people who buy from you can help determine what to provide them.
Market Trends
Keeping up with what is happening in your industry and in general markets will also guide decisions on stocking and setting prices.
Making Informed Decisions
With a comprehensive understanding of your sales data and other influencing factors, you can make informed decisions to optimize your inventory management and drive profitability.
Call to Action
Today, people have found that they can significantly improve their business operations, grow sales, and provide better customer service through point-of-sale (POS) systems.
Our sophisticated tools can unleash many benefits if used.
It is said that facts are the clear windows through which you see the world as it truly is.


