Creating a Dashboard with ChatGPT

As a programmer specialising in retail and Point of Sale (POS) systems, I recently embarked on an intriguing experiment: using ChatGPT to create a dashboard without relying on my programming skills. Much discussion has been about ChatGPT enabling non-programmers to write code, with dashboards often highlighted as a key example. I decided to test this claim, and the findings were illuminating.
What's a Dashboard, Anyway?
A dashboard is a visual display that displays important information, commonly called Key Performance Indicators (KPIs). These provide a quick visual overview of the current situation, helping us make informed decisions without the need to sift through large amounts of raw data.
For retailers, dashboards transform massive sales data into actionable insights in seconds.
The Experiment: Following a Non-Programmer's Guide
To simulate the experience of a non-programmer, I followed a YouTube tutorial that promised to teach dashboard creation using ChatGPT.
So, I selected this YouTube here. Please feel free to consider this article as my response article to it.
So, I started with data from our POS software's Sales Report, which has comprehensive insights.
The ChatGPT Experience: Not Quite as Advertised
Data Wrangling Woes
My first hurdle was getting the data into the correct format. While our POS system can export to JSON, I followed the tutorial's suggestion. Later, I found that I had made the correct decision as I would dive into Excel many times to manipulate the data. It became a recurring theme throughout the process.
Paid Account Required
Contrary to the tutorial's claims, I quickly discovered that a free ChatGPT account wouldn't cut it. The credits ran out faster than a sausage sizzle on a Saturday morning. The experiment would have ended if I had not had access to a paid account. Let me know if anyone wants a paid account, and I offer reasonable offers. So, I switched to the paid account to continue this experiment.
Dashboard Dilemmas
After multiple attempts, I managed to create a basic dashboard. However, getting it to look presentable was another story entirely. As any retailer trying to spruce up their shop window knows, making things look good is most of the work.
Real-World Retail Challenges
Then, I ran into the problem of using real-world retail data in an experiment. In business, things are not cut and dry. I would encounter these problems here.
Consignment Stock
Items on consignment threw off profit calculations, as they had no listed cost.
Gift Cards
These presented a similar challenge to consignment stock.
Payouts
While these transactions affect sales numbers, they don't contribute to profit.
I only discovered these issues through this exercise, and it took time to learn these problems each time. The solution was to return to Excel, adjust the data, and recreate the JSON file. It was like constantly restocking shelves but with numbers instead of products and then recreating the dashboard.
The Programming Plot Twist
By now, I had spent many hours. So, when trying to calculate the total profit, I hit another wall. After many attempts, I had enough, so I resolved this by going outside the tutorial's framework. I had to break character and lean on my programming expertise. I delved into the HTML code generated by ChatGPT to understand what was happening behind the scenes. Only then did I finally wrangle the dashboard into something usable!
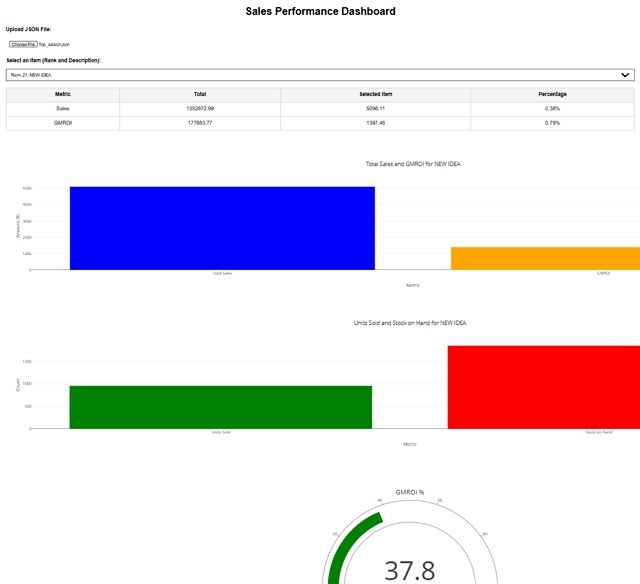
Now I had this, I could select a department, and it would give me these figures and charts.

Now I had something, but were the figures correct? After five hours of this exercise, I did not check, so it was unusable. In programming and business, it's rarely worth it for one-off jobs. You need stuff that, once done, repeats. Here, you must massage the data extensively before using it. The Bottom Line
It was presented as a quick and easy project for someone with moderate computer skills but turned into a time-consuming ordeal that required the following:
- Over five (5) hours of work
- Extensive Excel manipulation
- The ability to read and understand HTML code
- A paid ChatGPT account
Even after all that, I hadn't yet verified the accuracy of the figures—a crucial step that would likely take many hours more if they were wrong.
Lessons
While quickly creating custom dashboards is appealing, the reality is not yet here.


