
Retail is changing. As such, what people buy from you changed too. The problem here is that our memory is like a camera. What can be in it is what was not what is now. This can cause significant problems. Own here is an excellent report to show you the shift in your sales shop.
Go to Cash register > reports.
Then Sales -Register> Sales comparison for a given period.
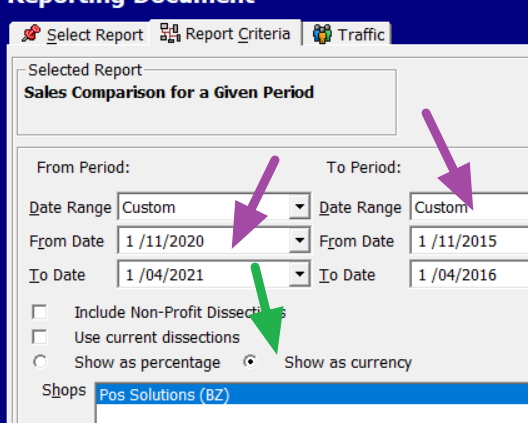
Above in purple, I put in the last few months and notice that I am using a few years back in comparison.
Now also notice in green that I changed the comparison from percentage to currency. This is because what happens is small departments often show dramatic changes. So, for example, a department with $5 in sales then, now having $20 sales, has a big percentage increase. In reality, is not much of a change
Try it.
Put in your figures and see.

