For Australian retailers, every dollar invested in inventory directly impacts the bottom line. Real-time inventory management revolutionises how you track, manage, and optimise your stock to maximise profits and boost your profitability. Real-time stock management offers many advantages that traditional techniques cannot in shape. Real-time inventory management provides many advantages that conventional methods can't match. Here's how it can benefit your business:
Real-time inventory management is essential for preserving optimum stock ranges and ensuring clean operations in your retail commercial enterprise. Here's a step-by-step approach to having access to your inventory records fast and effectively using our POS device:
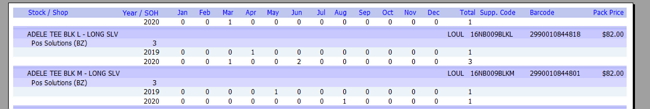
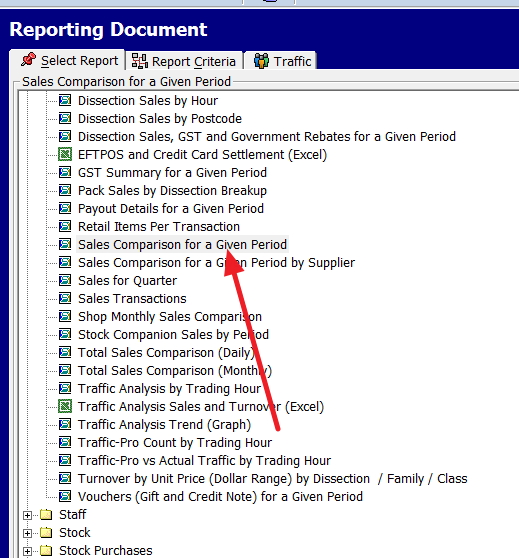
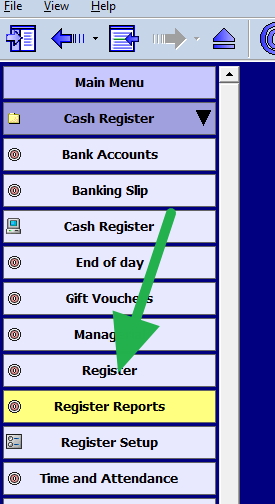
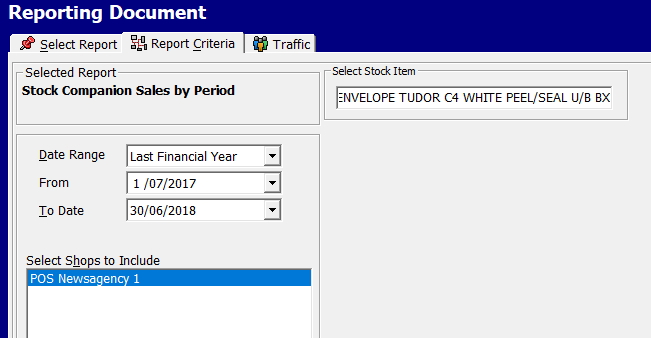
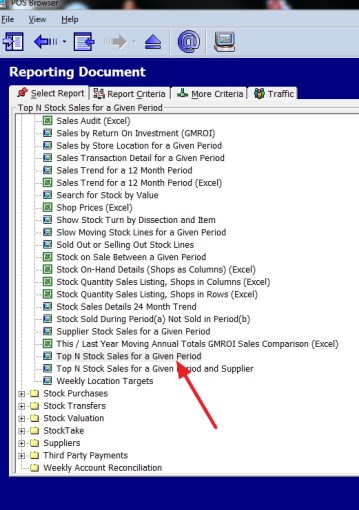
Navigate to stock performance. You'll find critical data about your current inventory levels and sales trends there.
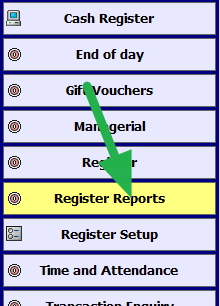
Step 2: Go to Register Reports
Within the stock performance section, locate the "Register Reports" option. It will lead you to various reports that provide insights into your inventory and sales.
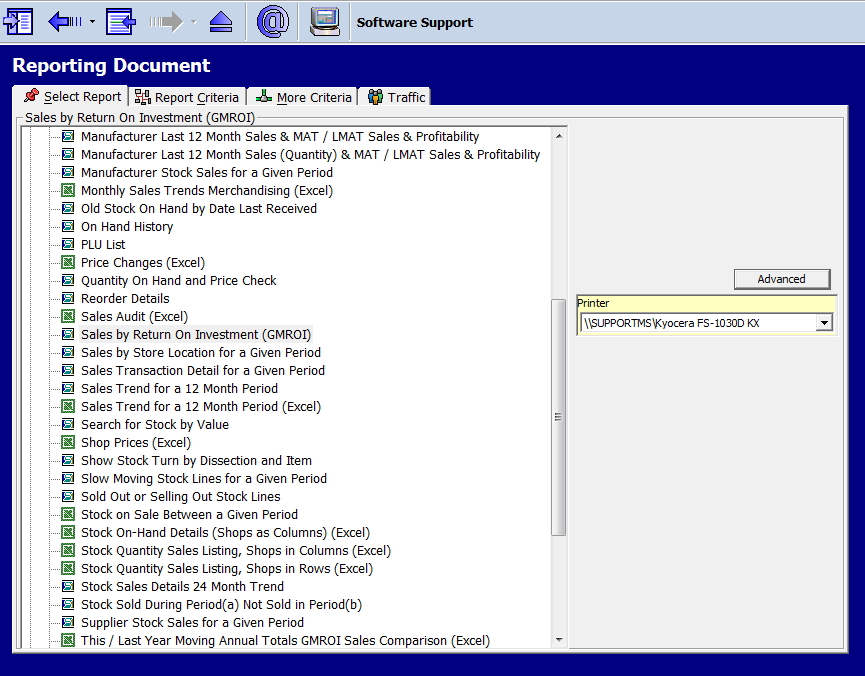
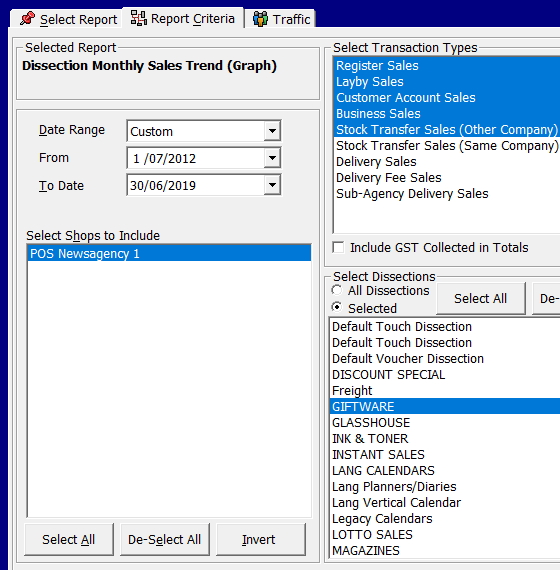
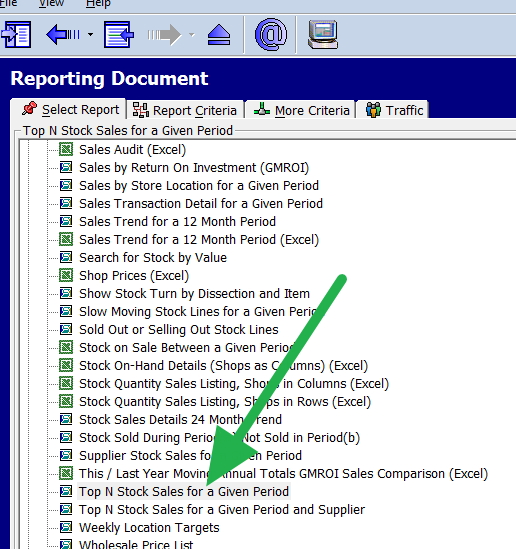
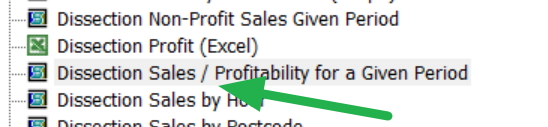
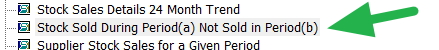
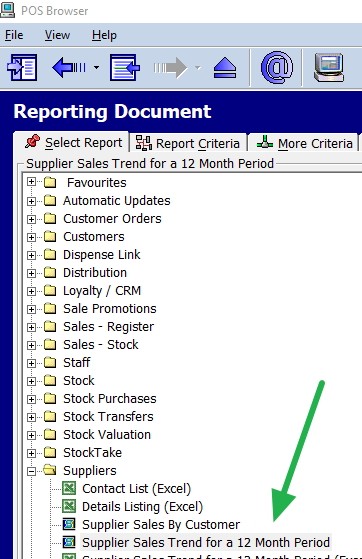
Step 3: Select Suppliers' Sales Trend
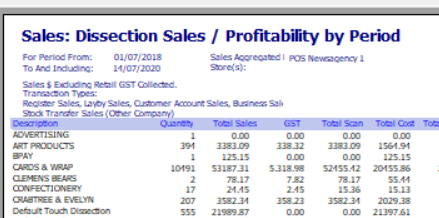
Once in the Register Reports menu, choose "Suppliers" and "Suppliers Sales Trend." This report will give you a comprehensive overview of how each supplier's products perform in your store.
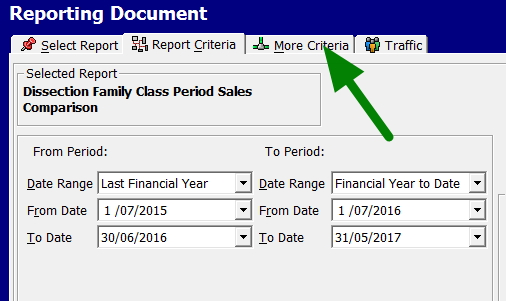
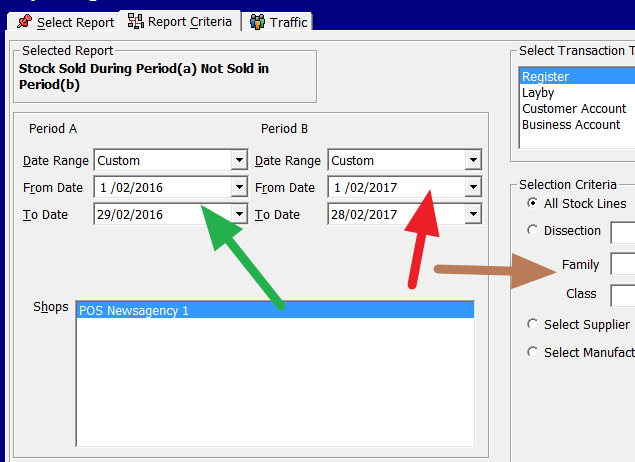
Step 4: Set Your Date Range
To get a meaningful analysis, set the date range for the past year. It will provide a complete picture of sales trends and inventory movements, helping you make informed decisions.
Step 5: Analyse the Report
After generating the report, take a close look at the data:
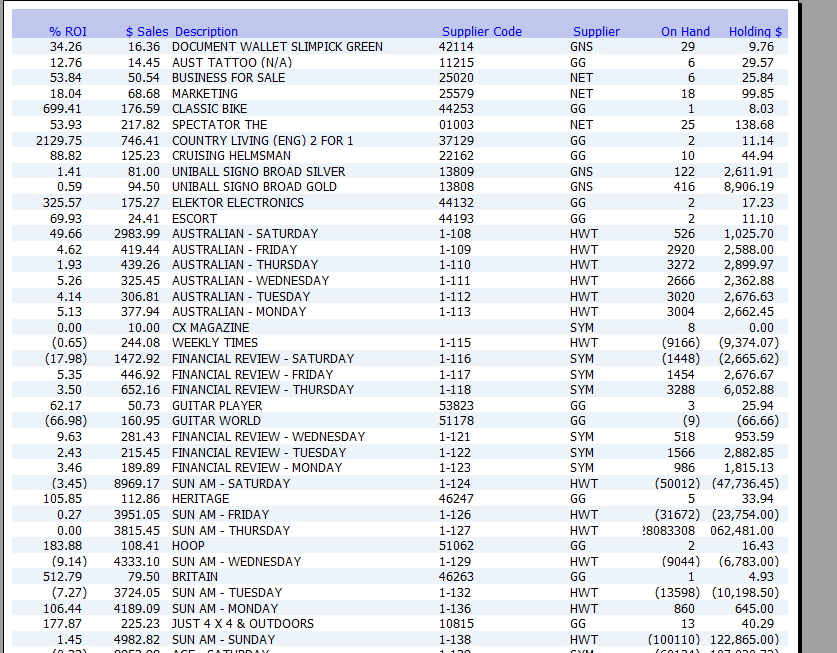
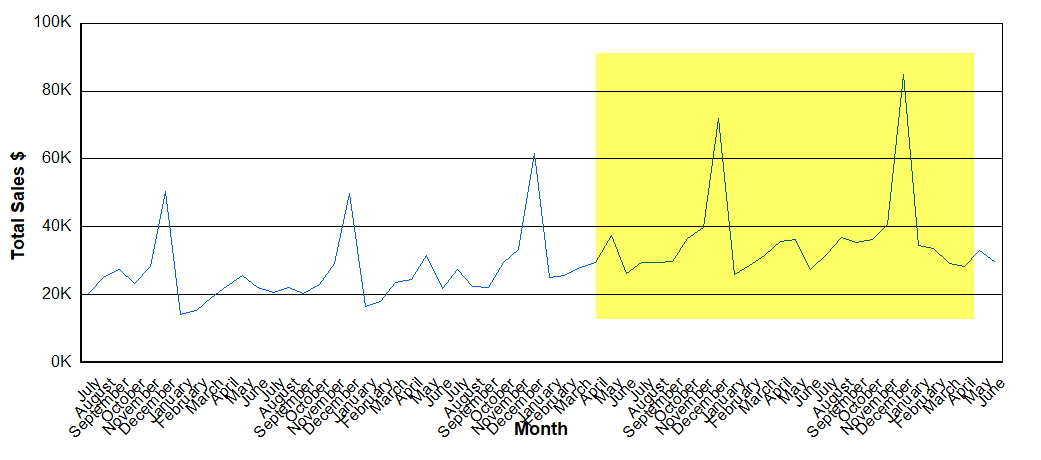
A report like this pops out.
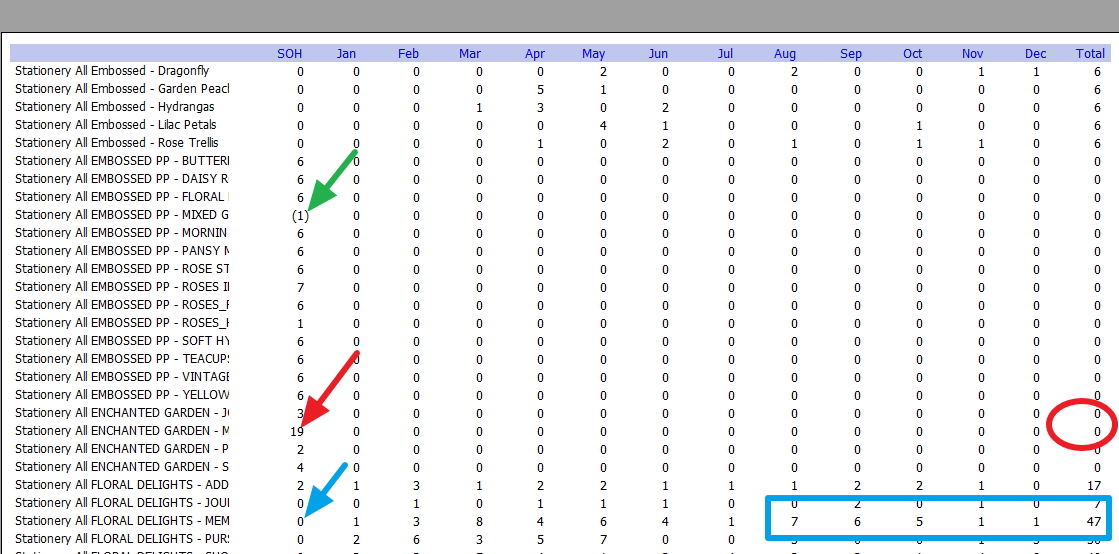
Let us go through it.
A negative stock item marked with a green arrow is a sign that your stock quantities are not wholly correct.
Look at the red arrow. You have 19 of these items now but have never sold any of them. This is a worry. Ask what happened.
Also, as you go down, you will see an item with a blue arrow. You have none in the shop. See how you have no stock but have sold many of these items.
Where is this going?
Retailers can get ahead of the competition in real-time. It will enhance your efficiency and increase sales.
Step 6: Take Action
Use the insights gained from your analysis to make strategic decisions:
- Adjust Orders: Modify future orders based on stock levels and sales trends.
- Communicate with Suppliers: Use your data to have informed discussions with supplier reps, ensuring they understand your needs and challenges.
- Optimise Inventory Levels: Implement adjustments to keep superior stock tiers, stopping overstocking and stockouts.
Following this step-by-step guide, you can efficiently access actual-time inventory information. This will empower you to make knowledgeable choices that improve your shop's performance and increase sales.
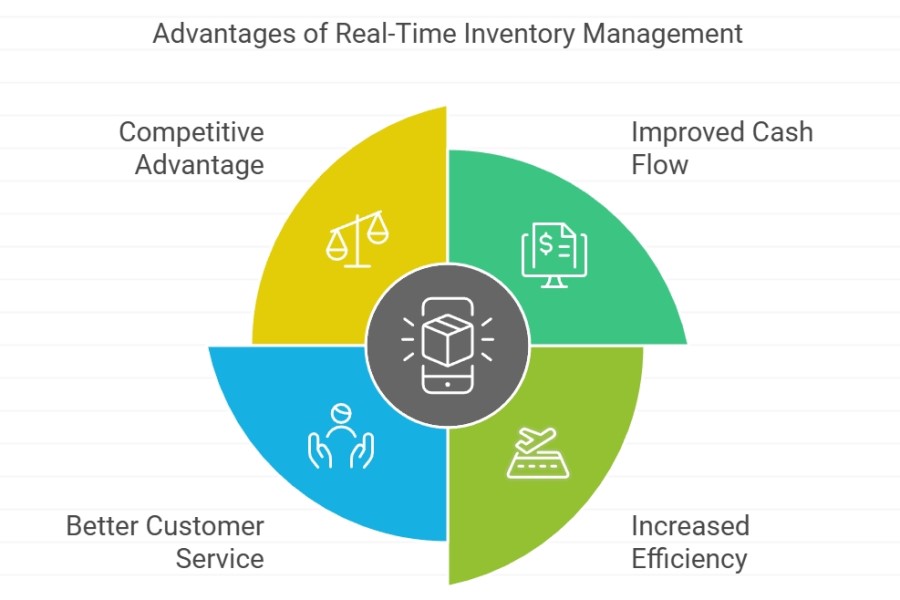
Improved Cash Flow
Optimising stock levels with real-time data frees up capital that would otherwise be locked away in excess inventory. ### Enhanced Decision-Making Access to live information lets you make knowledgeable buying, pricing, and promotions choices. You'll be able to respond quickly to market demands and adjust your techniques accordingly.
Increased Efficiency
Automating tasks like inventory counts and reorder approaches saves time and reduces human blunders, allowing you to focus on strategic activities that power the commercial enterprise boom.
Better Customer Service
Ensuring popular gadgets are always in inventory complements patron satisfaction and builds loyalty. Happy customers are much more likely to go back and advise your store to others.
Competitive Advantage
It is crucial to stay ahead of competitors who depend on previous methods. Real-time stock control offers the potential for quicker response times and more accurate forecasting.
Traditional vs. Real-Time Inventory Management
Traditional inventory control often suffers from old and faulty information, primarily due to sluggish reaction instances and reactive inventory degree optimisation.
Leveraging Real-Time Data in Supplier Interactions
Having instant access to your inventory records strengthens your position while dealing with providers. Here's a way to make the maximum of this advantage:
Review your inventory report before meeting with a supplier rep to identify areas of concern or opportunity.
- Demonstrate control by showing the rep that you have a firm grasp on your inventory situation through specific data points from your report.
- Ask informed questions using your data to probe deeper into product performance and seek solutions for underperforming items.
- Negotiate effectively leveraging your sales data to secure better terms and discounts on high-performing products or arrange returns for slow-moving stock.
- Avoid overstock pitfalls by resisting pressure to accept excess inventory, referring to your real-time data, and sticking to optimal stock levels.
Taking the Next Step: Implementing Real-Time Inventory Management
Ready to revolutionise your retail operations with modern inventory management? Here's how you can get started:
-
Book a Free Demo: Experience how our POS device can transform stock management. Our group will stroll you through the capabilities tailored to your commercial enterprise wishes.
-
Customised Implementation Plan: We'll create a personalised roadmap for integrating our POS system into your modern-day operations, ensuring minimal disruption to your enterprise.
-
Seamless Data Migration: Our professionals will switch your inventory information to a new machine, ensuring accuracy and completeness.
-
Comprehensive Staff Training: We offer thorough education periods for you and your group, ensuring everyone is confident in using the new machine to its full capability.
-
Ongoing Support: Our devoted Australian-based guide group is always available to help you with everything, from preliminary setup to destiny enhancements.
By choosing our POS device, you're no longer simply shopping for software programs but investing in a partnership devoted to your retail fulfilment. Our solution gives actual-time stock monitoring, automatic reordering, and insightful sales analytics designed to reinforce your profitability and streamline your operations.
Refrain from letting previous stock practices hold your business back.
Frequently Asked Questions (FAQ)
Q: What is a real-time inventory management system?
A: A system that gives you an actual inventory. It uses advanced technology to track inventory changes, permitting you to monitor stock levels, income developments, and crucial data in actual time. This machine lets outlets make knowledgeable decisions quickly, optimise inventory ranges, and respond promptly to marketplace demands.
Q: What is real-time stock management?
A: Real-time inventory control involves tracking and managing your inventory levels. It affords up-to-date information about your stock, enabling you to make informed choices quickly and efficiently. This technique permits fast updates to stock facts as transactions occur, ensuring you constantly have the most modern statistics for your inventory.
Q: How does actual-time inventory management benefit my commercial enterprise?
A: Real-time stock management gives numerous blessings:
- Improved Cash Flow: By optimising stock levels, you free up capital that can be reinvested in other business regions.
- Enhanced Decision-Making: Access to live records allows for knowledgeable buying, pricing, and promotional selections.
- Increased Efficiency: Automating duties like inventory counts reduces mistakes and saves time.- Better Customer Service: Ensures popular items are always in stock, enhancing customer satisfaction.
- Competitive Advantage: Provides faster response times and more accurate forecasting than traditional methods.
Q: How can I access real-time inventory information using your POS system?
A: Follow these steps to access real-time inventory information:
1. Access the Stock Performance Report: Navigate to the stock performance section in your POS system.
2. Go to Register Reports: Click on the "Register Reports" option to gain insights into your inventory and sales.
3. Select Suppliers' Sales Trend: For a comprehensive overview of product performance, choose "Suppliers" and "Suppliers Sales Trend."
4. Set Your Date Range: Set the date range for the past year to analyse sales trends and inventory movements.
5. Analyse the Report: Review data for negative stock items, slow-moving stock, and out-of-stock bestsellers.
6. Use insights to adjust orders, communicate with suppliers, and optimise inventory levels.
Q: What should I do if I find discrepancies in my inventory report?
A: If you notice discrepancies such as negative stock items or slow-moving products, take immediate action:
- Investigate the cause of discrepancies and correct any errors in your records.
- Adjust future orders based on accurate data to prevent overstocking or stockouts.
- Communicate with suppliers to address any issues with product supply or demand.
Q: How can real-time data improve supplier interactions?
A: Real-time data strengthens your position when dealing with suppliers by:
- Allowing you to demonstrate control over your inventory situation with specific data points.
- Enabling informed discussions about product performance and solutions for underperforming items.
Q: What steps should I take to implement real-time inventory management?
A: To implement real-time inventory management with our POS system:
1. Book a Free Demo: Experience how our system can transform your inventory management.
2. Customised Implementation Plan: We'll create a tailored roadmap for integration with minimal disruption.
3. Seamless Data Migration: Our experts will ensure the accurate transfer of your existing data.
4. Comprehensive Staff Training: We provide thorough training sessions to use the new system confidently.
5. Ongoing Support: Our Australian-based support team is available for assistance from setup to future upgrades.