
Now is an ideal time to see how you are going.
To do this, retailers often measure their performance by the current to last year's figures. Although many do this by months, working in quarters, here is better. But if you prefer months, work through this example with me now and then once you grasp it, do this analysis by months.
What this will do is show you how financially COVID hit your business. It will also give you insights into the health of your business. Everyone I have talked to about this has told me that their current financials look weird.
The report itself is elementary and straightforward to do with our system and will only take you a second to do.
Go to
Main Menu > Cash Register > Register Reports > under the Select Report tab, expand the Stock folder > select the report "Dissection Family Class Period Sales Comparison."
Then you will see this screen.
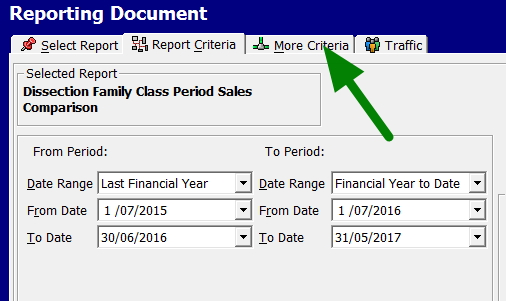
Now put in the left side.
From dates 01/10/2019
To Date 31/12/2019
On the right side
From dates 01/10/2020
To Date 31/12/2020
Congratulations! You have completed a Q4 analysis.
Now you have much to think about, I am sure.

