
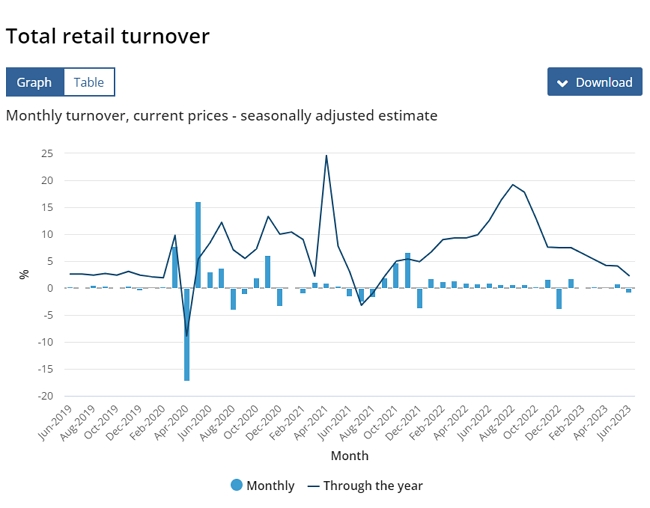
According to new data from the Australian Bureau of Statistics (ABS), overall retail sales increased by 2.3% in June 2023 compared to June 2022. The main drivers were food and restaurant/takeaway spending. These categories saw strong growth, but most other sectors were in decline. If you follow this, and I will show you have to compare your shop to these figures in your POS Software, but let us do some background first.
The figures are to be expected I think as I stated "With higher prices lately, we've noticed customers buying less discretionary stuff and just sticking to the basics. People are being more careful with their money."
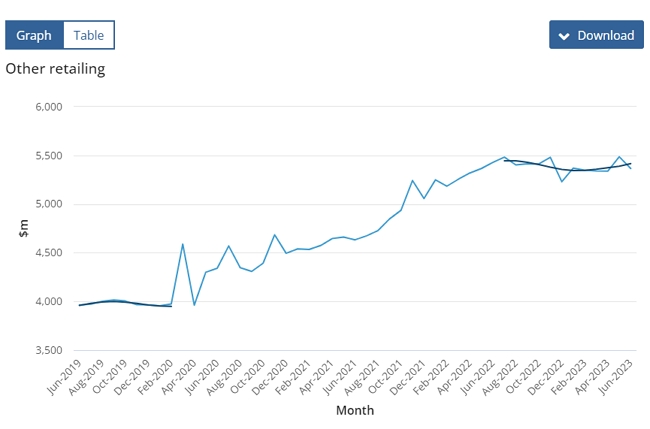
Many of our clients would be in the sector called Other retailing, this is how its graph looks.
Monthly Sales Dropped Slightly
-
Retail sales in June decreased by 0.8% from May.
-
But a small monthly drop in June can be expected; it also dropped in June last year.
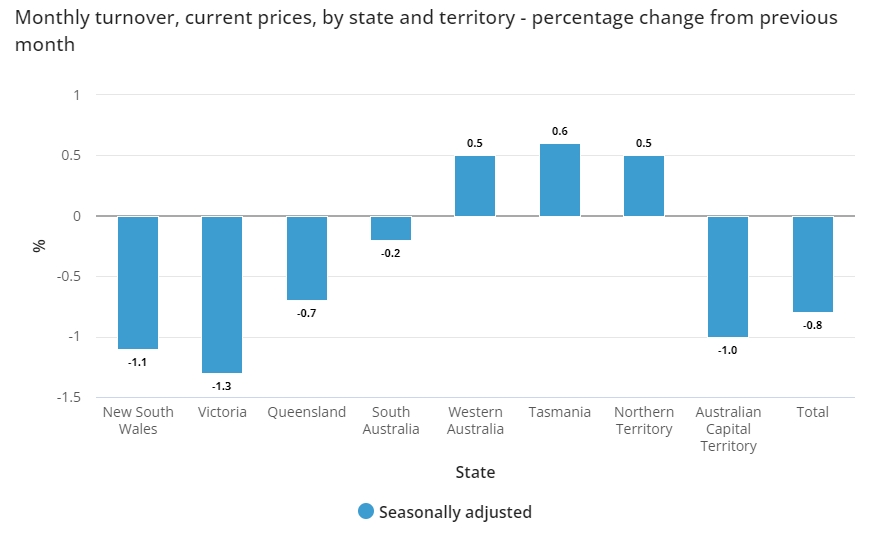
The ABS data showed Victoria had the most significant year-on-year decline out of all states. This aligns with what was expected, considering its recent economic struggles.
Key Takeaway for Retailers
Consider adopting some of these resilient categories like food products in your shop. I have several clients that have added many food products to their shops.
The full sector breakdown of the latest figures for retail sales is here on the ABS website, so check your sector out, find and download the relevant table of your shop.
Find out how you went to compare
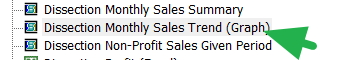
Go to your reports> Sales> Dissection Monthly Sales Trend (Graph)
Generally, when I start, I pick a very long period. I like to look at the long-term trend, so I used seven years here. This gives me an overall feel that I can use to compare with the ABS figures although I think you should be careful as from March 2020 to June 2022 we had a lot of disruption caused by COVID.
Now I get this graph.
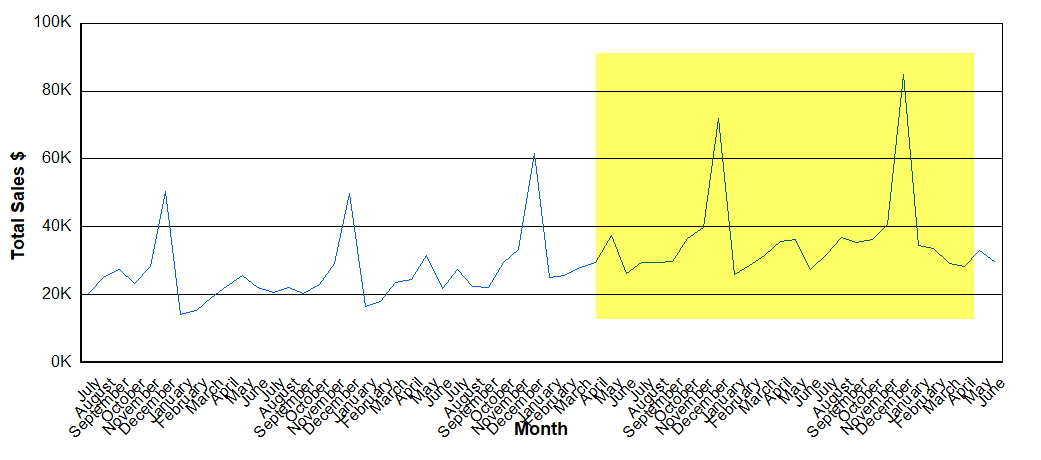
Something to chew about!

