How to use your data to have better stock control
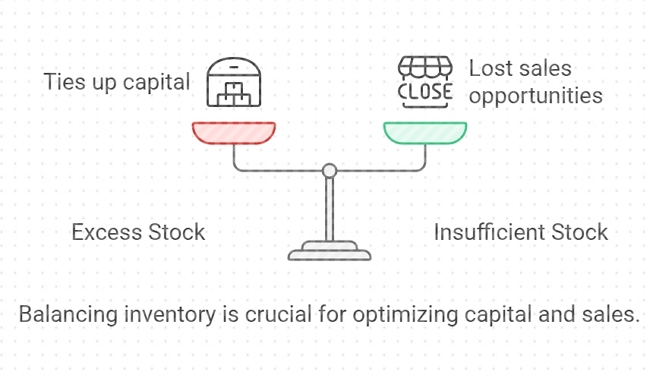
We are all balancing inventory—excess stock ties up capital, while insufficient stock can result in lost sales opportunities.
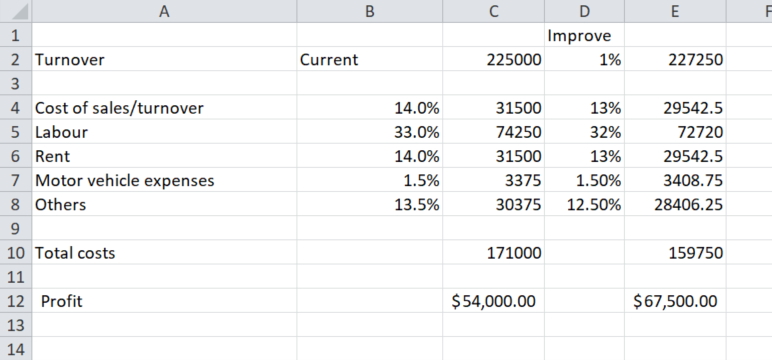
Here is a simple key to improving your stock control that is available now, and it will boost your bottom line.
Understanding the Power of Historical Data
Big suppliers don't just guess about stock control—they rely on historical data. They compare monthly sales year over year to identify trends and patterns. They tend to use 24 months of your data, which helps them account for seasonal fluctuations and make more accurate predictions.
But with a modern POS system, you've got all the tools you need to play in the big league.
Why Your POS Data is Gold
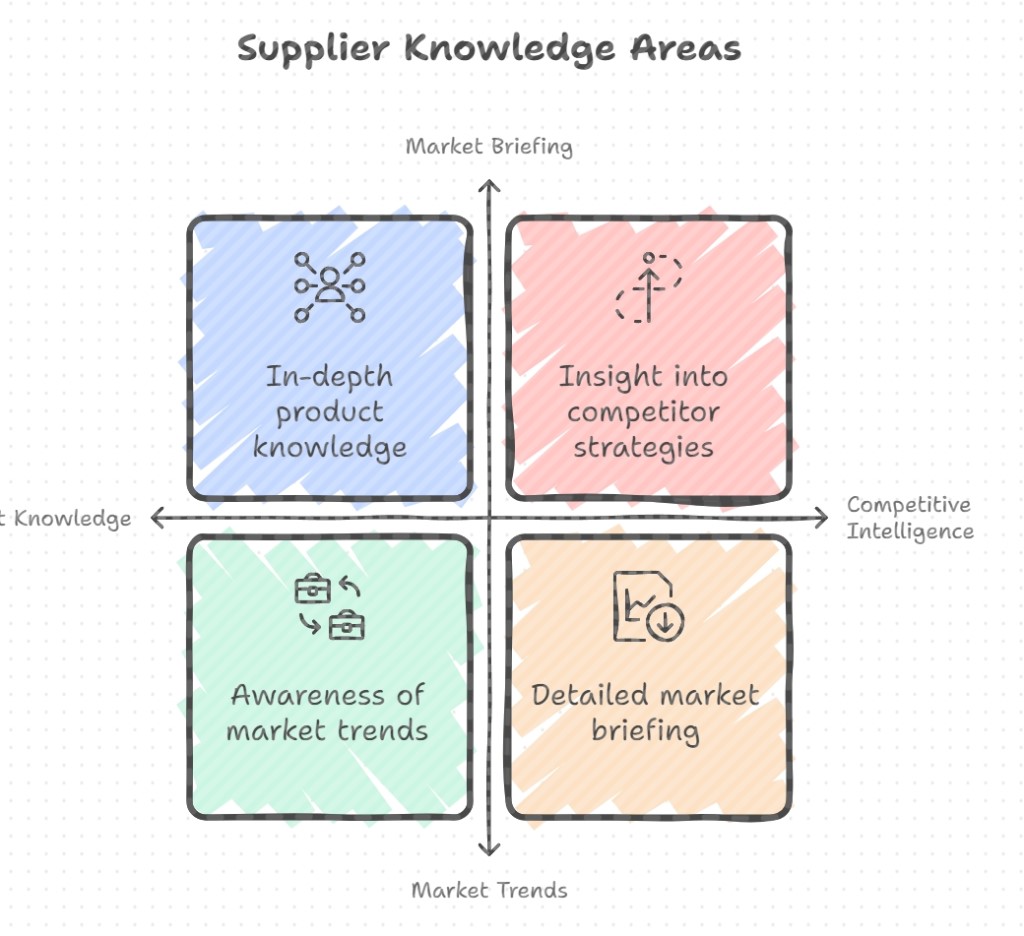
Your POS system isn't just for processing transactions, it full of valuable information. Here's why it's better for you than your supplier's information:
Real-time sales data
Unlike your suppliers, who only see what you've ordered, your POS system shows exactly what you've sold.
Seasonal insights
By comparing data from the same months across different years, you can spot seasonal trends specific to your business.
Stock level optimisation
With accurate sales data, you can decide how much stock to hold.
How to Use Your POS Data for Better Stock Control
Let's walk through a practical example of how you can use your POS data to improve your stock control:
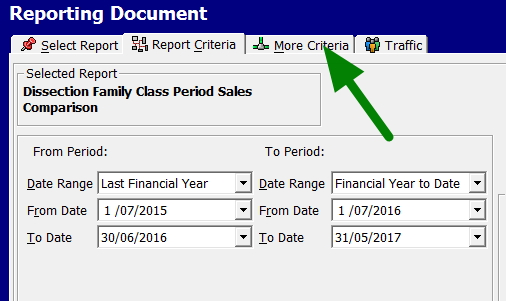
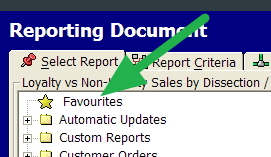
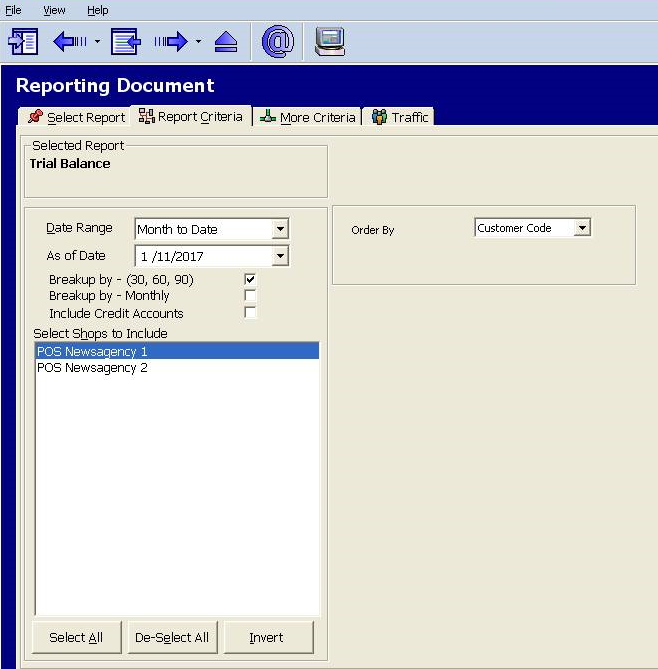
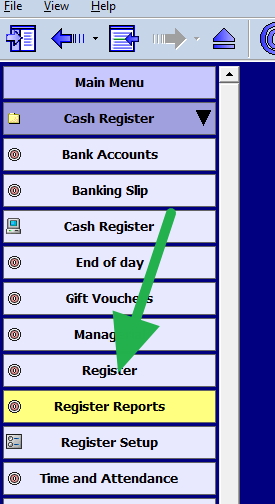
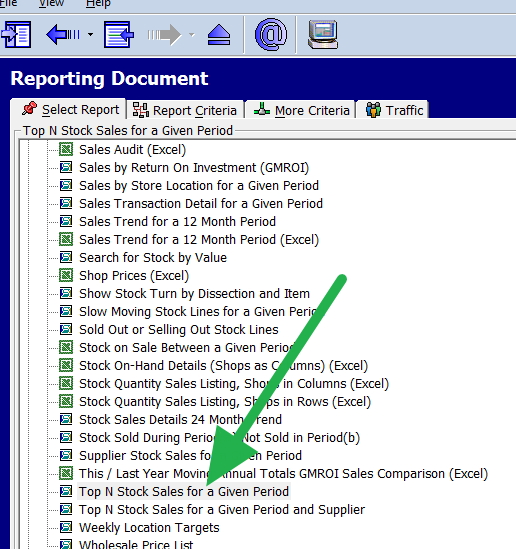
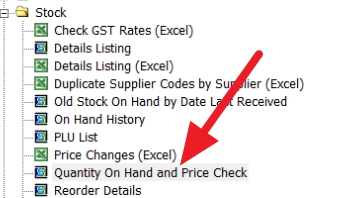
Access your sales report
You'll find this under 'Reports'> 'Sales'> 'Stock Sales Details 24 Month Trend'.
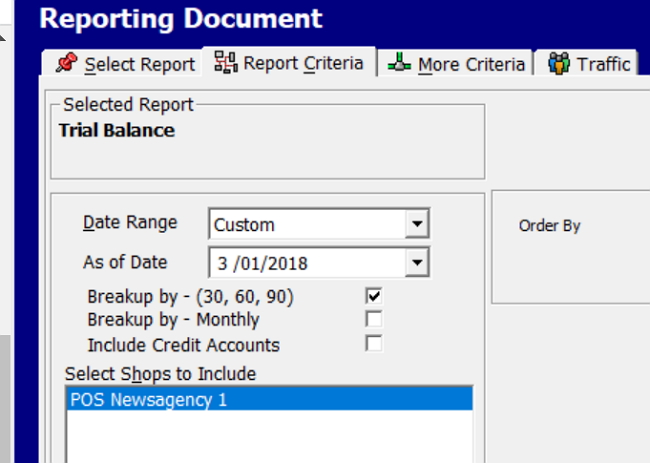
Filter your data
For this exercise, we'll keep it simple:
Exclude inactive stock Filter by department or supplier
Analyse the trends
Look for patterns in your sales data. Are certain items consistently selling well? Do some products have seasonal spikes?
Evaluate stock levels
Compare your current stock levels with your average monthly sales. Do you need to be more overstocked on slow-moving items?
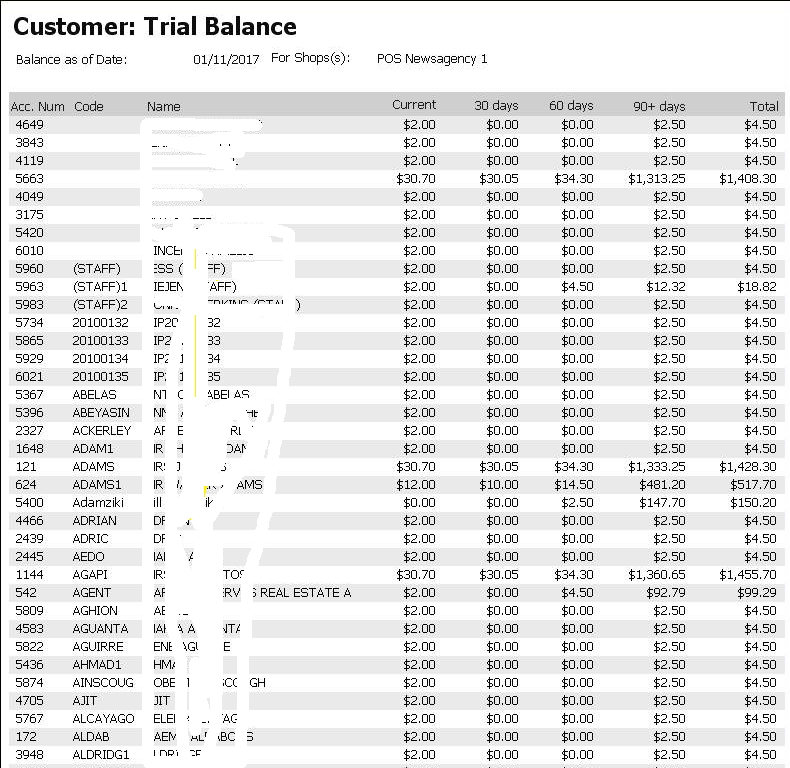
Case Study: Spotting Overstock Issues
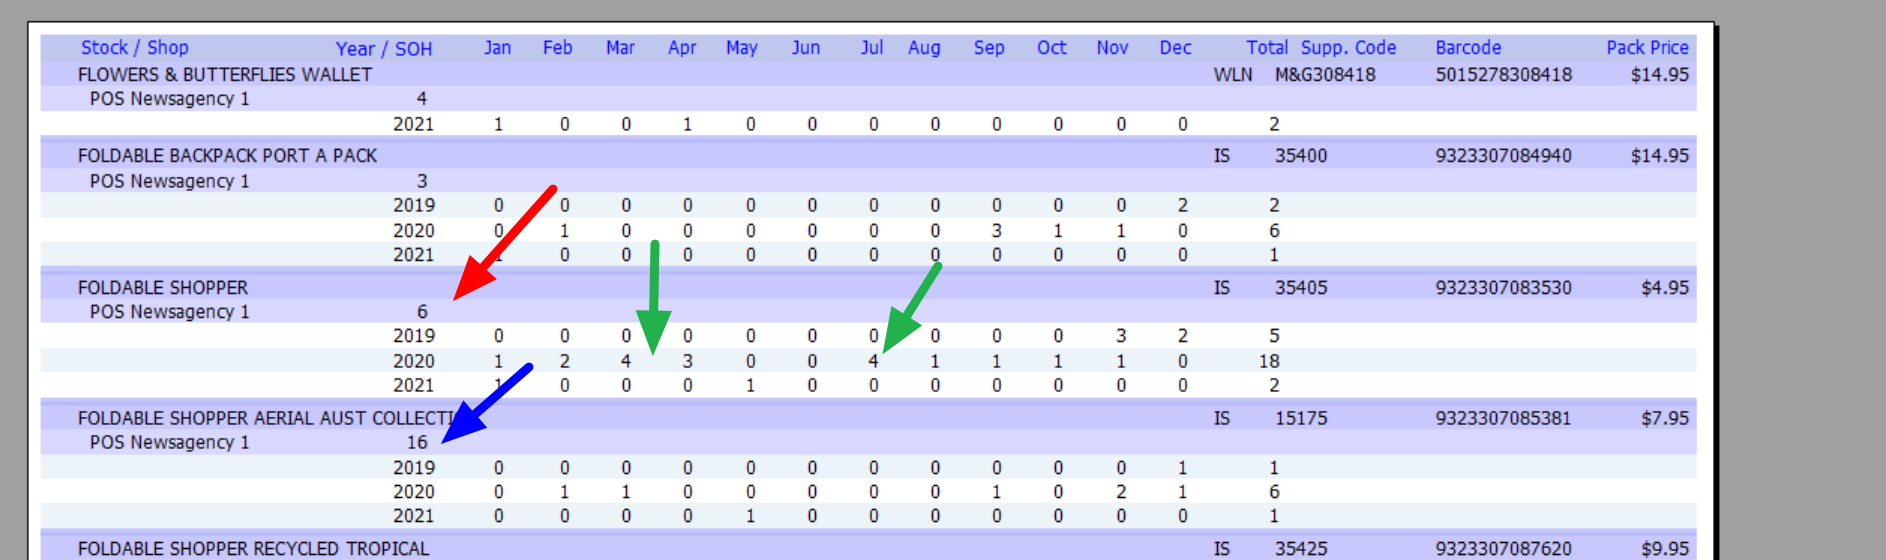
Let's look at a couple of examples from our report:
Product A
Average sales: 2 per month Current stock: 6 units Stock cover: 3 months. If you can reorder this product weekly, holding three months of stock might be excessive. Consider reducing your stock levels to free up capital.
Product B
Average sales: 0.5 per month (1 every two months) Current stock: 16 units Stock cover: 32 months (nearly three years!) This is a clear case of overstocking. Unless there's a specific reason for holding so much stock (like a bulk discount or upcoming promotion), you should look at significantly reducing your inventory of this item.
Turning Insights into Action
Now that you've got this knowledge, here are some steps you can take:
Adjust your reorder points
Use your sales data to set more accurate reorder points for each product.
Negotiate with suppliers
Armed with solid data, you can better negotiate order quantities and frequencies with your suppliers. In my experience, most suppliers will listen to you if you have an issue.
Plan for seasonality
If you spot seasonal trends, plan your stock levels accordingly.
Clear out, slow movers.
Identify products that aren't selling well; now you have something to think about and what to do with them.
Focus on your winners
Make sure you're well-stocked with these winners.
The Bottom Line
Leverage your POS data; don't guess. Make informed decisions about your inventory. This approach can help you: Reduce tied-up capital Minimise storage costs Avoid stockouts of popular items With your cash flow
Your POS system is a powerful tool that gives you the information you need to compete.
Our POS software makes it easy to access and analyse sales data.
Contact us to learn how we can help you optimise your stock control and boost your profits.