
I am going to talk about the five of the KPIs that I consider to being the most important retail and how they are used. Today I will discuss the KPI, *Days of Supply*.
Days of Supply is defined as how long you expect to have stock of an item.
It is a key statistic as the following example will show.
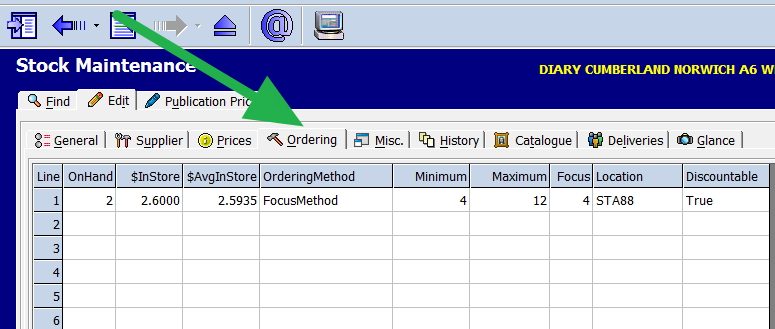
Now look at this item in ordering. I have two (2) on hand. My focus figure is four (4) sales a week. So I can say it is likely that I have only two (2) Days of Supply before I run out.
If I usually order in a few day's time, my supplier and they take two days to send me the item, then its quite likely that I will run out of it before fresh stock arrive. What I need to do is put an order in ASAP.
However, if the supplier takes a week to deliver the order, well I need to do something more extreme as I am going to run out of the item soon. Maybe move the item from a high quality selling position and put it somewhere else and use that position for items that I have stock I can sell and only sell this item to people that request it.
If, on the other hand, I had nine (9) on hand, well I have two weeks supply, and I do not have to order for a while.
If I had forty (40) on hand, well I am badly overstocked and need to consider how to move the product faster.
This analysis of course assumes that the sales continue at the same rate as recent sales, and we know that this may not be true for seasonal items or high selling seasons where the sales rate often changes dramatically in which case you will need to adjust although focus can take much of this into account.
Our point-of-sale system shows you this information, so you can reduce lost sales.

