
As a retail business owner now, it will be many months before you know how your business travelled in 2023. Here is a quick method to check and compare your yearly sales figures.
Year-over-year comparison
First, pull total sales reports for the past few years. For example:
Go to register reports.
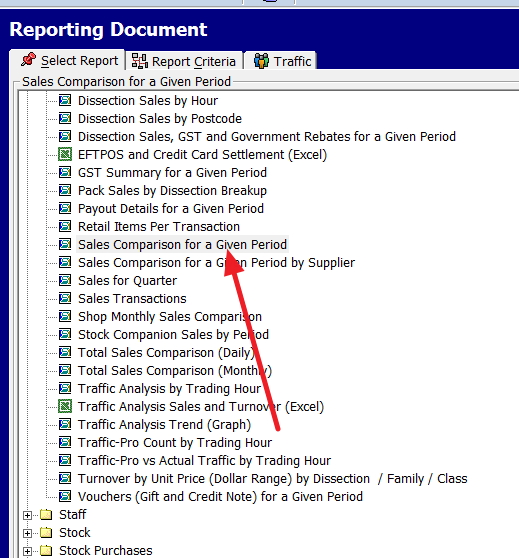
Now select the item marked "Sales Comparison for a Given period".
Note you can do it by a supplier, but that can be done later when you have more time for detailed analysis. What we are doing here is getting a quick idea.
1) Put in here the dates
01/01/2022 to 31/12/2022 AND 01/01/2023 to 31/12/2023
This will take you a few seconds. Then you will get detailed information showing how you went in 2022 compared to 2023.
Write down some key figures. on the report that you wish to measure.
2) Now go back in and run the report with
01/01/2020 to 31/12/2020 AND 01/01/2021 to 31/12/2021
You now have four years of information to study. This should give you a pretty good idea of how your business travels now. I find drawing a graph of sales shows me a clear picture. I hope these figures went well for you.
Sales trends
Say, for example, I have figures like this
- 2020 total sales: $450,000
- 2021 total sales: $485,000
- 2022 total sales: $510,000
- 2023 total sales: $560,000
Compare the totals to identify upward or downward sales trends over time. Steady yearly growth suggests your efforts are working.
Evaluate Suppliers Sales
Use the same method except this time to break down sales by your suppliers month-by-month.
See how the supplier is doing for you.
Compare Operational Factors
Now, some questions to ask yourself.
- Did you expand hours, staffing, space or inventory?
- Did you run more promotions or advertising campaigns?
- Did you add or remove product lines or services?
Data-driven decisions
Use this to make data-driven decisions for your business to move forward. See what is working, what’s not, and where your retail business needs to head next. Let data guide your strategy. Turning those sales insights into concrete actions to improve your future performance is vital. Let the data direct you toward new opportunities for sales, traffic, and profit growth in 2024!

